The idea of a Basic Income is not a new one. Canada even has it's own organization advocating a basic income.
Canada's Poverty Line is currently at $19,019 per person (individual, the number is different for couples and families) which works out to $1,585 a month. Half of which is $792.5
There are all sorts of proposals for how a Basic Income would work, but I'll present mine in what I feel is the simplest and easiest manner possible.
$792.5 is close to $800, and round numbers always sell better, so, we start using that figure.
Next, we make the policy as follows
1 - Each "family unit" gets $800
2 - Each person in that "family unit" gets $800
This means that me, Teddy, as the only member of the Teddy "family unit" would get $1,600. If I found a nice girl to marry, we would get $2,400. If we had a child, we would get $3,200. So on and so forth.
This applies to everyone. I get it, you get it, Harper gets it, the homeless person on the street gets it, the Rogers family gets it, a newborn gets it, a 120 year old gets it, everyone would get the basic income.
So, how would we pay for this?
The Basic Income would replace ALL 'universal' government transfers, and all transfers of money that are means tested.
So what does this include?
I am currently on ODSP, the Ontario Disability Support Program. Anyone passes the means test (IE is poor) and qualifies as "Disabled" in Ontario gets ODSP. The Basic Income would mean the end of ODSP.
Welfare would also be eliminated. As would pensions. The Baby Bonus would also go.
Currently, I get $1,098 a month on ODSP, so how would we pay for that extra $702?
Part of it will come from the wages of ODSP workers who are no longer needed. This won't cover all of it, however, as many of them will be needed to administrate the Basic Income, or to administrate targeted programs for those who need more serious help such as those physically or mentally incapable of taking care of themselves.
And the remainder of the money? That would come from taxes.
In order for this to work, we need to change income taxes. At $800+$800, $19,200 becomes the new "floor" that every Canadian makes in a year. As such, 0% income tax should be charged on this amount. After that, however, given the new "free money" we need to flatten out the curve of income tax at the lower end. As such, we should eliminate the 15% tax bracket and extend the 26% tax bracket to meet it.
We can do the math to estimate how much more in taxes a person would pay if they made exactly $138,586 a year. The answer is $13,362. So such a person, who makes $138,586 a year would now be paying $18,930 more in taxes, yet receive $19,200 in basic income, meaning they are about $300 better off despite income taxes being hiked.
The remainder of the gap would be made up by savings from less wages.
This does not even take into account the savings from eliminating Pensions and Welfare.
There is still more complex math to be done. Under this system, Canada would now have a flat tax rate of 29%. Simply closing all the loopholes could bring in the additional revenue needed. It's also possible that that rate could be increased, or decreased, as needed.
Lastly, and most importantly, this only works with the co-operation of the Provinces. The program would need to be jointly funded and would not work if the provinces don't want it. This, perhaps, is the largest stumbling block to the entire idea.
Wednesday, September 30, 2015
Tuesday, September 29, 2015
29SEP2015 Projection - text version
I've decided to make the best out of a bad situation.
My time is very limited today, so rather than release a "normal" projection, I will do one without any maps or images, and use only text. When my projection does come out, it will likely be identical to this, but, will include maps and riding results.
TOPLINE
Having been decoupled from the polls, we find the Liberals are ahead based on an expected shift to the party from NDP voters to stop the Tories.
124 - LIB
110 - CPC
100 - NDP
2 - GRN
1 - BQ
1 - FD
The Atlantic has been re-adjusted with care given to re-balance the provinces. This means the NDP no longer does as well within NB. This better matches it with riding polls. This is also good news for the party as those voters have to go somewhere (if they are at 26% in the atlantic, and were at 26% in NB, but are now at 22% in NB, that means they [because they are still at 26% in the atlantic] are doing better in the other atlantic provinces)
As a result, the Tories are now well ahead of the NDP in Saint John.
There were also more in-depth riding adjustments. At current, the NDP is sitting at 28.5% in both Charlottetown and Egmont. The NDP also has seen a boost in rural Newfoundland.
Quebec has more of the "attention grabbing" changes.
Plamondon is now ahead in his seat comfortably. Fortin is also ahead, leading by 3 points over the Liberals. While the NDP continues to dominate in the corona, they are losing seat after seat in the regions.
Ontario is where my adjustments are most significant. Previously, the Liberals had been ahead in Toronto (the 416) by a huge margin and behind in the 905. There are polls showing the opposite is true, and, riding polls match that trend. As a result, things have been re-balanced. Peggy Nash is now leading in her seat by near 15 points, and the NDP is set to win 9 Toronto seats, despite their presumed drop in Ontario that I've already taken into account.
Manitoba also needed some significant adjustments, and I'm still not fully satisfied. I currently have them at 36% in the province, and as a result, at 43% in Winnipeg. This matches polls taken of Winnipeg. Despiste that, the riding results I get are nowhere near the riding polls, even after I've adjusted the ridings individually. It's just impossible for the Liberals, at 43% in Winnipeg, to only be at 38% in South Centre, which is perhaps their strongest riding there (outside of those held by star candidates) Saskatchewan has nothing of note.
Alberta is where some major changes are taking place, as I have the Liberals outpolling the NDP. I'd like to make a point of one thing:
The Liberals continue to hold, in the projections, Calgary Skyview. And they have held, in the projection, Calgary Skyview since 2013.
While it is possible for them to lose Skyview, and even Centre, it is impossible - with the Liberals taking about 2 votes for every 5 the Tories take in the province - to not walk away with a Calgary seat.
Lastly is BC, which continues to be a general mess thanks to 3 way races. The Greens, at these levels, are seen picking up Victoria.
A few interesting ridings
Victoria, where the Greens at 33.2% lead the NDP at 31.6%
Saanich Esquimalt, with the NDP winning at 32.5% ahead of the Greens at 27.8%
Vimy, winning NDP at 31.5% over Liberals at 31.3%
Louis Hebert, NDP at 29.9% over Tories at 27.4%, Libs at 21.6%, and Bloc at 19.9%
Ridings the Bloc have "any hope in hell" in:
Sherbrooke
Saint Maurice
Richmond Arthabaska
Quebec
Manicouagan
Laurentides
Joliette
Gaspesie
Chicoutimi
Charlevoix
Rimouski
Berthier
Becancour
Vercheres
Salaberry
No, Duceppe will not win, even if all these other seats are captured.
Lastly, a note for those stumbling here from google. Before you report "riding polls done by Teddy on Politics blog" do yourself a favour and look around. This is an election projection website that uses math. We take federal polls, at the provincial level, and use tried-and-tested mathematical means to turn that into a riding-by-riding level projection. These are not polls, and are not presented as polls. The only way someone could mistake them for polls is if they have happened across this website for the first time and don't bother checking any page except this one before making a presumption and running with it.
Monday, September 28, 2015
Projection update tomorrow
Expect a projection update on Tuesday.
As well I am taking the extraordinary step of "decoupling" the projection from the mathematical poll average. I did this during the NDP's meteoric rise in 2011 so that I could better project that rise without being "held back" by polls that had, by the time of release, become significantly out of date.
I will "recouple" the projection to the polls on Friday.
Theory, Errors, and Changes
A few quick notes.
1 - I've made some changes to how Ontario is presented. As such, I have new maps!


.None of the ridings have changed party, but there is a important change. First, the riding of York Simcoe has been moved from the "rural" map to the "toronto" map.
Secondly, I've outlined Toronto. I will be presenting Toronto separately from the rest of the GTAGGH in the tables when presented. This will allow all the tables to better fit into the space available.
2 - The ElectoMatic had an error.
For some reason it thought that there was an additional, invisible, riding in Montreal. At the time this error was caught, it was assigning that magic seat to the Liberals. As such, the Liberals have dropped by 1 seat in the projection.
3 - I have a theory.
We know from various polls that around 10% of supporters of any party will say they have no "second choice" if their party were not on the ballot, and turnout figures seem to reflect this, in that, if a party is missing, there is no huge stay-home vote.
This has, however, not held true for the Tories, where that number is closer to 50%.
The theory is that this is because people are simply unaware of parties like the Libertarians and the Christian Heritage Party.
One problem is that a huge issue for the Tories, terrorism, is not supported by either of these parties. I don't mean that the Tories "support terrorism" I mean that the specific viewpoints the Conservative Party of Canada has on terrorism is not something that is found in either the CHP or Libertarians. As such, there could be a higher than expected "stay at home" vote.
This, however, would indicate that ~35% of Tory supporters could fit into either the CHP or Libertarians. Given the party is around ~35% in the polls, this means that if the Conservative Party of Canada were to not exist, that the Libertarians and CHP would be polling around ~5% nationwide, and be battling with the Greens, and Bloc, for 3rd place. Given the CHP has a capitalist economic outlook, it is possible that it would even bring on board supporters from other parties, and if not for the Tories, could be at 10% in the polls, and could be leading in ridings like Abbotsford, Crowfoot, and Middlesex-Lambton.
Sunday, September 27, 2015
27SEP2015 Projection - Summary
The NDP is down to only 99 seats at this juncture

However, as noted, that 100th seat belongs to Peggy Nash, who may retain it on personal popularity.
A few notes
First, even if the NDP took 0 seats in Quebec, this projection would still be the 2nd best result for them in the history of the party.
Second, the NDP is facing some real weakness. Momentum is swinging against them in a huge way. So huge that seeing the party at 25% as a poll average a week from now is not out of the question.
Third, with the NDP in trouble, the Liberals stand to gain in a huge way. If the party can break away, with the NDP falling to 25%, and the Tories steady at 31%, the Liberals could become the "clear leader" with 35%. If that happens, it is really only a matter of time before voters who want to stop harper jump on the bandwagon, and we see the real potential for a Liberal majority.
27SEP2015 Projection - Ontario
The NDP continues to weaken here. So much so that Peggy Nash looks to be in real danger of losing her seat to the Liberals. I'll certainly examine this riding in detail to see if this is, indeed, the case.


27SEP2015 Projection - Quebec
Some significant changes here. Liberals are up. In addition, the Tories really seem to be the "stable" growth in the province on 'muslim' issues. One interesting thing was that one poll compared phone and online polling, and the Bloc in particular was impacted by the difference. My view is that this is because their vote is 'softer'. Despite that, they have gained a seat compared to the last projection


27SEP2015 Projection - West
In Alberta, the Liberals are ahead in Edmonton Centre. I am still investigating if this is something I need to modify, as all logic would dictate the NDP should be ahead, but for now, it stays


In BC, NDP weakness has allowed a few ridings to fall to other parties, pushing the Green seat count up.


Analysis: NDP in trouble & Announcement: Projection update this evening
A short post.
The NDP is in trouble. The previous post will explain part of the reason why. I will also go into greater detail as I do my projection this evening.
I will be adding the first "Momentum Adjustment" of this race. It is, in short, the opposite of poll averaging, where I amplify the changes to the poll average to try and project future polls. This will apply to the NDP and will be universally in the "down" direction.
This does not mean you'll see the NDP taking "only" 50 seats, but it does mean you may see a projection of mine where I have the NDP polling a point or two beyond their lowest low in the past week of polls.
As for the projection, expect regions (starting with the small 63) to come out starting this evening, and late this evening (perhaps into the early morning hours, depending on your time zone) I will wrap up the projection and provide the full combined results; as I've concluded the "front" should be the last, not first post in the series.
I would remind people that despite this adjustment that we are not at the point, last time, where the NDP started it's rise in the polls, in 2011. As such, the NDP could still manage a majority if the momentum changes direction. It did in 2011. In 2011 we saw a good 5 to 10% drop off the Bloc in Quebec early in the election and go to the Liberals, That "blob" of voters then switched to the Tories, before switching to - and staying with - the NDP. It's quite possible that those currently leaving the NDP will change their minds.
Saturday, September 26, 2015
Analysis: How did you vote last time?
So I was thumbing through a recent poll, as I'm prone to do, when I noticed the "past federal vote" did not match up. In fact, it didn't match it's own math. It claims over 1400 respondents, yet, all responses only add to 1315.
So I did a bit of math. It turns out that only 36.58% claim to have voted Conservative last time, compared to the 39.62% that actually did. That in itself is not a "big deal"
However for the NDP it was worse, with only 23.95% saying they voted NDP, compared to the 30.63% that did in reality.
The Liberals, meanwhile, were over-estimated, with 22.5% claiming they voted Liberal, while only 18.9% did.
I thought maybe I'd have better luck comparing this to the 2008 results. That itself leads to problems, as the NDP took only 17.48% and the Liberals, 26.26%.
However I stuck on something odd...
The averaged 2011 and 2008 result.
According to that, 24% voted NDP. 24% claim to have voted NDP in the poll. 22.5% voted Liberal. 22.5% claim to have voted Liberal in the poll.
I'm not quite sure what this means, but I will continue to investigate. This averaging works for all parties except the Greens, which are consistently over-represented.
Friday, September 25, 2015
NDP at 25% in RoC? Is that really so bad?
A very short post where I remind people that prior to 2011, the best election the NDP ever saw was in 1988, when they took 20% across the country.
In that election they reached...
37% in BC
17.4% in Alberta
44% in Saskatchewan
and 20% in Ontario
In 2011, they managed...
30% in Nova Scotia, and New Brunswick
15% in PEI
26% in Manitoba
and 26% in Ontario
I uurge people to keep this in mind when they read polls of how "bad" the NDP is doing. Even if the NDP wins "only" 80 seats, is is still a massive historic win for the party.
Crazy Fantasy
So what if something impossible happened?
What if the Greens captured 20% in BC?

What if Wildrose ran Federally?
 What if the Tories continued to dominate the Prairies?
 What if the Tories bombed in Ontario?

 What if the Bloc came back to live in Quebec

 What if the NDP won the Atlantic

Realistic? No.
But interesting.
What if the Greens captured 20% in BC?

What if Wildrose ran Federally?


Realistic? No.
But interesting.
Wednesday, September 23, 2015
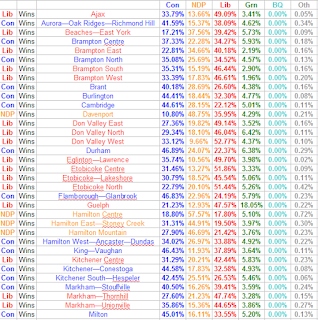
23SEP2015 - Ontario
Last but certainly not least, Ontario, where the Tories currently hold a majority of seats (as of this projection)


23SEP2015 - Quebec
The NDP may be in trouble here, with the Liberals picking up ridings due to NDP weakness and growing Liberal strength.


Quickie: Throne Speeches
Trudeau and Mulcair have now come out saying neither will vote for a Conservative throne speech.
While both have implied they'd also refuse to abstain to let one pass, as far as I know, neither have come out against it.
To me this indicates the strategy on the part of both men.
If Harper wins the most seats, or even ties with someone, they will allow him to continue... up to the speech.
During that time I expect both (Trudeau and Mulcair) would talk to one another. I expect Mulcair to offer a coalition and Trudeau to turn it down. Regardless, they will feel out what the other would do in government and then find some way they can support one another without it being political suicide. I expect a deal, either for 18, 24, or 36 months, that will see one of them form the government with a level of support from the other. I doubt it would be a full coalition (with a cabinet made of members of both parties) but may be a half coalition (with the budget written, in some part, by both parties, but only one party in cabinet).
Feel free to share your thoughts on this below.
23SEP2015 - West
The NDP, at least according to the most recent polls, may be in trouble in some of these areas. We'll see if they bounce back, as I expect them to.


23SEP2015 - Small 63
Not much commentary here. Tories manage to pick up a NS riding (compared to previous projections)


23SEP2015 - Massive Update, Front Page
I've done a massive update to the ElectoMatic. It's still "broken" but it works far better.
Given the difficulty of uploading a huge number of images, I've broken down the more detailed updates into sub-pages. The updates will be broken down as follows:
The Small 63
These are the 63 ridings in "smaller provinces and territories". In short, the Atlantic, as well as the Central Prairies (Manitoba and Saskatchewan) and the Northern Territories. These 63 seats are from provinces and territories that are limited by the Grandfather clause, and as such, these 63 seats, while they may have moved around within their respective provinces, have remained since the mid 70's. They are 14 seats for Manitoba, 14 for Saskatchewan, 11 for Nova Scotia, 10 for New Brunswick, 7 for Newfoundland, 4 for PEI, 1 for Nunavut, 1 for Yukon, and 1 for the Northwest Territories.
The West
Given that Manitoba and Saskatchewan are already accounted for, this "West" consists only of two provinces, Alberta with 34 seats, and BC with 42 seats. These 76 seats easily out number the small 63 and are an important battleground this election with the Tories trying to hold on against not only resurgent NDP numbers, but increasing Liberal numbers as well.
Quebec
We finally get into some of the largest provinces with Quebec and it's 78 seats. This update will focus on this province and will will document the successes and failures of the NDP and Liberals to capture the province.
Ontario
It is in Ontario that we truly see huge masses of votes. The greater GTA has 71 seats all to itself, a number able to compete with either Quebec or our definition of The West. This leaves a whopping 50 seats for the rest of Ontario. If the Tories are to win the election, they will need to win here.
For now, the front-page, and as such, national summary. Expect 4 more updates over the next few hours detailing the projection update.
Tuesday, September 22, 2015
Analysis for September 22nd
A few things I've noticed.
First, the gains the Liberals had in Ontario seems to be slowly slipping away. The Tories are inching ahead. This is likely due to the fact that we are further and further away from the days (or perhaps the day) where Trudeau and his policies were lead stories in the news. His announcement that he'd be willing to run a deficit seemed to really catch attention and differentiate him from Mulcair and Harper. However, two things are impacting that.
First, it's been a while. We've not really seen Trudeau, or any other leader, be the lead in the news due to their policies in a while. Parties are doing more reacting than they are acting.
Second, according to the Tories, the deficit is gone. This also has taken a bit of the wind out of this argument as it would mean going back to deficit rather than staying with one.
Second, the NDP seems to be running into some trouble in Quebec. This seems focused on racism, if I may be so bold. There are simply some in Quebec who are anti-islam. Sure you can say "it's not racism, it's religionism" but the impact is the same, the motivation is the same, and the pure ignorant hate is the same.
This has boosted the Bloc numbers, though not enough to be winning seats, but also seems to be increasing Liberal fortunes.
So what's happening and why?
Simple put, about 2/3rds of Canadians want a change in government. The big issue is they are split between the Liberals and NDP. The only thing they know for certain is that they do not want Harper to remain PM.
At this time, when the Tories are second, or perhaps even third, that means these voters still have the luxury of thinking and waiting to make up their mind. With the CPC increasing in Ontario, this is becoming a tougher sell. People will need to decide who they want, Mulcair and the NDP, or Trudeau and the Liberals, and when they do and the momentum starts to swing, the Tories will be knocked out of any first place they may temporarily retake and be pushed back into second, or third.
There are a few things on the horizon.
I'm watching the NDP numbers with increased attention. There is some indication the NDP may be losing their core base. Fewer and fewer people are telling pollsters they voted NDP last time. This is a huge problem for the party if it continues. Why? Well in the last Ontario election, there were fewer people who admitted to voting PC than actually did in the prior election, and, the PC Party was thus over-estimated in the polls. In 2012, fewer Albertans admitted voting Wildrose, and they underperformed the polls. In BC it was the NDP that suffered. And in Quebec, at least for the first half of the election, the PQ.
If the NDP continues on this trend - where fewer people admit to having voted NDP last time than reality dictates - it means the NDP will not perform as well as the polls indicate. My suspicion is this comes from Quebec, and if true, it could mean that the margin between the NDP and the Bloc could shrink by as much as 10% from the final election poll to the election itself.
As always, I'll keep you updated on the goings on.
~Teddy
Monday, September 21, 2015
Central Nova update
Riding polls are often not trusted very well. Part of the reason is some of them don't come true. What I've discovered is that "behind" certain riding polls is a "presumed" level of provincial support. The "peaks and valleys" remain constant, but, the raw support does not.
In short, this means that a "wrong" riding poll is actually "right", but for another support level.
Why does this matter?
Central Nova
Up till now I had been presuming that Peter MacKay had a huge personal vote. The recent riding poll, however, indicates this is not the case.
In my earlier projection, I had the Tories, in Central Nova, on 25.07% of the vote.
I've gone into the ElectoMatic and removed the "No MacKay Penalty" from the party.
Central Nova is thus the only riding in the entire projection that changes, and it changes to the following:
NDP - 31.33%
CPC - 30.30%
LIB - 29.27%
GRN - 8.78%
OTH - 0.32%
Central Nova is thus, now, by far, the most winnable riding for the Tories in Nova Scotia. But, at current support levels, would go to the NDP.
"Current Support Levels" presume the Tories are way down at 17.5% in the Atlantic as a whole.
As such, any slight bump, and this riding will turn blue.
Good morning, folks!
I decided to throw the doors open a few hours early, and we officially opened last night. Feel free to check out that post here.
I also have a few more solid ideas about how this website/blog will progress.
First, we will continue to follow the Canadian Federal election - and only that - until October 19th. I'll be ramping up the time I spend developing this website during that period to match the ramping up of interest of Canadians.
Do not expect daily projection updates before October. Do not be surprised if there are two updates a day in the week before the election, and do not be surprised if there are updates to the entire nationwide projection, every few minutes, in the early hours of counting, based on the limited real hard results.
I also may not do a full riding by riding update for every province at every projection. I will let demand dictate this, and demand will be gauged by your comments. If there is the demand for such full updates, I will consider it.
Next, I will be working on adding historical results for comparison. I will be focusing on comparing one election to the next. As such, do not expect a dozen information points for elections like this one, rather, I will be combining certain things to make the comparison of one election to the next easier. As such, expect, in the case of the election above, the "Progressive" totals to include Labour, UFA, UFO, and Independent Progressive members.
I will take time and care to note where and when changes are significant and mark it as so, but will also do my best to combine results where needed to make for ease of reading. In short, you should be able to quickly reference the document to see the rise and fall of various parties, and quickly determine if we are currently looking at something unique, or something that has happened before.
That's pretty much all for now.
Why you can't have my election file (actually you can if you ask nice)
I am willing to share the spreadsheet file that I use to project these elections, but, I warn you; it's broken.
Let me clarify.
How it is supposed to work:
You find a new poll or poll average you want to put into the program.
You open the program.
You put in the numbers.
Automatic Math.
More automatic math.
More automatic math.
The results come out the other end.
How it currently works
You find a new poll or poll average you want to put into the program.
You open the program.
You put in the numbers.
Math.
(program has stalled)
It will produce the results wanted, but, it does not do so automatically. You can force it to work properly using various means and methods, but the reality is, this file is incomplete.
Why?
Well, frankly, after 2011, I actually quit making projections. I retired. I did not really expect anyone would want to see my 2015 projections that badly. I was not expecting to start my own website, and as such, my crappy incomplete file would serve only to satisfy my own curiosity.
If I find the time, I might try to fix the problems, but given how close we are to the election, it's frankly just a better option to start from scratch using the official results when they are published some time in November.
Still. If you really want the file, e-mail me. I go by TheNewTeddy everywhere, twitter, facebook, and on e-mail. E-mail is the best way to reach me if you want the file, and I can be found @ hotmail.com
Sunday, September 20, 2015
Grand Opening!
I know it's still the evening of the 20th, but I've decided to throw open the doors of this website.
Sadly, my time is extremely limited, but, I do have a full projection, fully up to date, ready to go.
Expect more analysis in the coming days. For now, straight to the numbers and the maps.


Sadly, my time is extremely limited, but, I do have a full projection, fully up to date, ready to go.
Expect more analysis in the coming days. For now, straight to the numbers and the maps.


Subscribe to:
Posts (Atom)