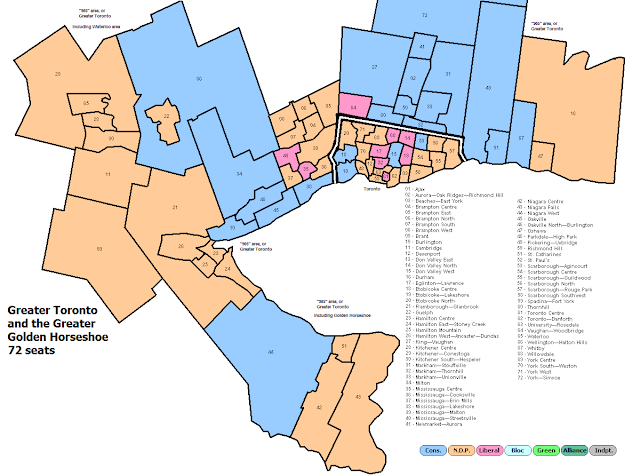
In short; we are aware that this is a PC-NDP race because you and I are political animals. Many voters are not aware, yet, that this is a PC-NDP race, and, when they become aware, will stop wanting to vote Liberal, and will start wanting to vote NDP.
This is the trend of the election. We've seen voters switching Liberal to NDP since the writ was dropped. A Mainstreet poll from early in the year had the PC Party at 43%, the Liberals at 32%, and the NDP at 18%. The most recent poll, as of the time of writing, from Pollara, has the NDP at 38%, the PC Party at 37%, and the Liberals at 18%.
You and I may be fully aware the NDP is in the lead, but many voters are not. People are not nearly as engaged as most of us hope they would be, even during an election.
This is what I am correcting for.
This is the kind of thing I mean when I say I am correcting for the trendline.
I am estimating what the popular vote will be once the electorate is "up to speed", as they tend to do as the election draws closer. It is my supposition that once they are fully "up to speed", and all the Anti-Ford and Anti-Wynne people realize the NDP is a safe bet, that the NDP will be at or around 41%, the PC Party at or around 37%, and the Liberals at or around 19%.
This would give them the following result:
65 - NDP
47 - PC
12 - LIB
This would result in an NDP Majority.
Neither Ford nor Wynne would be returned; however, there are caveats. I am assuming there will be an Anti-Wynne vote as many people personally hold her responsible for the failures of her government. This is similar to how Premiers Charest and Getty lost their seats at various points, despite the raw math suggesting they should not. As for Ford, I had to bump up the PC total to try to estimate his personal popularity. It is possible I under-estimated it, and, he would win even in this scenario. Unfortunately, without additional data (such as a riding poll) it is difficult to tell, and we are still far enough from the election that I don't feel a compelling need to delve into hours of polls to ensure this seat is correct; I have other seats to do that for and a limited amount of time to do that in. Be assured that by June 6th and my final projection, this and all seats will have had time spent looking at it individually.
Also note that I only make actual changes to the base math that I feel are significant. As a result, you'll notice that Jack MacLaren does not appear whatsoever in my spreadsheet. I consider his election so unlikely that the work to add him would be a waste. I have had voters in a riding the NDP won in 2014 with 52% of the vote, and where they are projected to win with a much larger share, complain that the party I have in second in that riding is incorrect. Frankly, this is not a difference I feel is significant enough to justify a change to the math.
I will, always, take a look at ridings that are close, and adjust them as needed. There are many reasons for adjustments. They can include but are not limited to:
- A very popular candidate ran for a party last time, but the current candidate for that party is much lesser known.
- A popular candidate is running this time, but did not run last time.
- A candidate has managed to get themselves into a scandal of some sort.
- A party has managed to get themselves (un)popular in the local area due to their (lack of) support for a particular policy
These are things I look for an try to take into account, but if the party is not able to win the particular riding in question, the impact on what people generally want to know most of all - who is going to win the riding - is minimal. As such, I do not put resources (IE time) into refining these aspects when I feel that my resources could be better spent elsewhere.
I hope this answers a lot of misconceptions that I've seen over this election campaign. Keep in mind that you can always make your own projections using the same math I do:
https://docs.google.com/spreadsheets/d/1WvTuHrZOiqcVBQ4VNWPMO03oqfPJCY1H9DGliUtsgL4/edit#gid=1072939327
Copy this sheet and change the numbers in the black coloured cells.
Remember to check back for any updates I may have made to the sheet in the interim so you can grab a fresh copy with the revised math.


No comments:
Post a Comment