Thursday, September 29, 2016
Introduction to Canadian Politics
Wednesday, September 28, 2016
Quick Update: Utah
I've been focusing on making videos, so please check my channel for my latest updates. I've also taken a look at the US election.
I've looked at some polls from Utah. The state seems to be the only interesting one this year. There are a lot of states that are 49%-51%, and many that are 40%-60%. That's boring. Utah however consistently has an "other" vote that beats the top candidate.
40.7% - Trump
31.9% - Clinton
13.4% - Johnson
11.2% - Evan McMullan
1.7% - Constitution Party Candidate
1.1% - All Others Combined
McMullan is Mormon, and from Utah, so is likely to get support that way. This may be the first time that a state votes for 4 candidates over 10% each in a long time. However, we'll need to see how this goes.
Tuesday, September 27, 2016
Teddy on Politics on Youtube
It's official, our first official video, an introduction to the channel, is out on Youtube. You can watch it here.
Monday, September 26, 2016
US: 6 weeks to go
Not much commentary again, things are simply solidifying.

The coming debates do have some potential to change things, but even that is limited. Given how and when things really begin to change in US election, we may still have another week or two to go before we can really start to see any changes. Until then, it's likely the only changes we will see to this map is more solidifying of various states.

The coming debates do have some potential to change things, but even that is limited. Given how and when things really begin to change in US election, we may still have another week or two to go before we can really start to see any changes. Until then, it's likely the only changes we will see to this map is more solidifying of various states.
Saturday, September 24, 2016
Announcement: Youtube Podcasts
After a few months of thought on the topic I've come to some realizations. While I'm a visual learner, I am not, if I can butcher a phrase, a visual speaker. I do like maps and tables, but I do not think that the sort of visuals in CGP Grey videos, for example, will help me very much.
As such I am starting an experiment; podcasts on youtube on the topics that I think are worth making videos about. This means, in short, not many, if any images. This will be something to 'listen' to.
I am hoping I can make the first one tomorrow; but I won't make any guarantees, but I will say that I will continue this experiment through at least a dozen such videos going to the end of the year. If I find this is working, I will continue.
Friday, September 23, 2016
Electoral Reform: Pure Proportional Representation
Much of the debate about a possible proportional system is centred around the idea that there would be some kind of nationwide list. This article is part of that. Frankly, that idea is nonsense. While there could well be some kind of national equalizing list, such as exists in places like Norway, the base proportional districts would be provincial in nature. This is in no small part because current constitutional arrangements demand it.
As such, I want to use this opportunity to examine the idea of "Pure PR" That is Proportional Representation without any locally elected members. This contrasts with MMP, which is Proportional Representation where people still elect a single local MP. Not many countries use Pure PR, and those that do tend to be smaller.
So what new ridings would we have? The answer to that is actually quite simple if you look at it. Proportional districts tend to be large to ensure proportionality. As such we can easily define the first 8 proportional districts.
Prince Edward Island - 4
Newfoundland - 7
New Brunswick - 10
Nova Scotia - 11
Saskatchewan - 14
Manitoba - 14
Alberta - 34
British Columbia - 42
Each of these provinces would have a single province-wide proportional district, and elect the same number of MPs as they currently do. Nothing about Proportional Representation prevents that, and in fact, nearly all proportional systems do things this way. The idea of a national list in Canada is absurd.
So what about the larger provinces? A proportional district with 121 members (Ontario) could be quite unwieldy. As such, we will be dividing up the larger provinces into smaller, more easily manageable chunks.
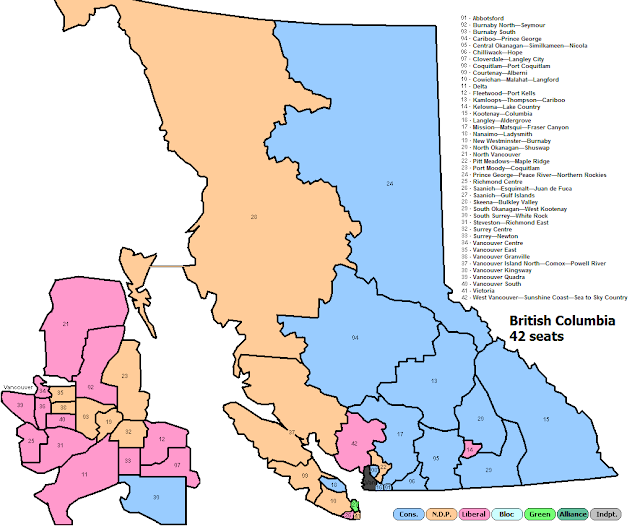
I've decided to use areas between 30 and 60 members large. As such, I present 2 maps, for Ontario and Quebec, divided into their new proportional districts.


For Quebec the division is perhaps most obvious. The Montreal area is it's own district, while the rest of Quebec is also it's own district. Ontario is somewhat similar, but due to the population, three districts are needed rather than two. Toronto and it's neighbouring regions, York, Durham, and Peel, become a central riding, while the remainder of Ontario is divided into North East and South West.
Like my earlier post on STV, I want to examine what an election would look like under this system.
Using D'Hondt, we get the following results:
NL:
6 - LIB - 165,418
1 - NDP - 54,120
0 - CPC - 26,469
0 - GRN - 2,772
PEI:
3 - LIB - 51,002
1 - CPC - 16,900
0 - NDP - 14,006
0 - GRN - 5,281
NS:
7 - LIB - 324,816
2 - CPC - 93,697
2 - NDP - 85,468
0 - GRN - 17,630
NB:
6 - LIB - 227,764
2 - CPC - 112,070
2 - NDP - 81,105
0 - GRN - 20,551
Atlantic Subtotals:
22 LIB // 5 CPC // 5 NDP // 0 GRN
MB:
7 - LIB - 268,280
5 - CPC - 224,527
2 - NDP - 81,960
0 - GRN - 18,944
SK:
3 - LIB - 131,681
7 - CPC - 267,937
4 - NDP - 138,574
0 - GRN - 11,527
AB:
9 - LIB - 473,416
21 - CPC - 1,150,101
4 - NDP - 224,800
0 - GRN - 48,742
BC:
15 - LIB - 829,816
13 - CPC - 708,010
11 - NDP - 615,156
3 - GRN - 194,847
Western Subtotals:
34 LIB // 46 CPC // 21 NDP // 3 GRN
After which we get into Quebec
Greater Montreal Area:
17 - LIB - 881,148
4 - CPC - 250,755
10 - NDP - 554,070
8 - BQ - 445,006
1 - GRN - 55,107
Rest of Quebec:
12 - LIB - 636,525
9 - CPC - 456,638
10 - NDP - 521,296
7 - BQ - 379,138
0 - GRN - 40,288
Quebec Subtotal:
29 LIB // 13 CPC // 20 NDP // 15 BQ // 1 GRN
And into Ontario
North East Ontario:
15 - LIB - 835,201
12 - CPC - 633,213
5 - NDP - 304,078
1 - GRN - 62,853
South West Ontario:
15 - LIB - 809,235
14 - CPC - 801,147
7 - NDP - 405,389
1 - GRN - 68,854
Greater Toronto Area:
26 - LIB - 1,286,957
17 - CPC - 865,033
7 - NDP - 376,449
1 - GRN - 54,285
Ontario Subtotal:
56 LIB // 43 CPC // 19 NDP // 3 GRN
Nationwide Total:
141 LIB // 107 CPC // 65 NDP // 15 BQ // 7 GRN // 3 from the Territories
You'll notice I didn't mention a threshold; that's because there is none. The size of the districts act as their own threshold. The largest one has 51 members which puts an effective threshold of around 2%. This means none of the parties last-time that did not win seats, would win seats under this new system.
Compare our result above to an absurd nationwide list:
135 LIB // 109 CPC // 67 NDP // 16 BQ // 11 GRN // 0 Libertarians
Despite the fact the Libertarians were the next most popular party, despite the fact I am using no threshold, they win 0 seats. In fact you'd need to expand the commons to 473 seats before they win a seat. You can check for yourself here. (presuming the link lasts)
One reason the Liberals do better under the regional system is how strongly they won the Atlantic, which is given more seats than its population would otherwise grant.
So what of this system? It's very unlikely we'd ever get it; given that it eliminates local representatives. However, in short, it would distribute seats based on the proportion of votes. That means an end to majorities.
There is not much more to say on it. I will, however, examine the other systems that are being looked at in posts in the coming days and weeks.
As such, I want to use this opportunity to examine the idea of "Pure PR" That is Proportional Representation without any locally elected members. This contrasts with MMP, which is Proportional Representation where people still elect a single local MP. Not many countries use Pure PR, and those that do tend to be smaller.
So what new ridings would we have? The answer to that is actually quite simple if you look at it. Proportional districts tend to be large to ensure proportionality. As such we can easily define the first 8 proportional districts.
Prince Edward Island - 4
Newfoundland - 7
New Brunswick - 10
Nova Scotia - 11
Saskatchewan - 14
Manitoba - 14
Alberta - 34
British Columbia - 42
Each of these provinces would have a single province-wide proportional district, and elect the same number of MPs as they currently do. Nothing about Proportional Representation prevents that, and in fact, nearly all proportional systems do things this way. The idea of a national list in Canada is absurd.
So what about the larger provinces? A proportional district with 121 members (Ontario) could be quite unwieldy. As such, we will be dividing up the larger provinces into smaller, more easily manageable chunks.
I've decided to use areas between 30 and 60 members large. As such, I present 2 maps, for Ontario and Quebec, divided into their new proportional districts.


For Quebec the division is perhaps most obvious. The Montreal area is it's own district, while the rest of Quebec is also it's own district. Ontario is somewhat similar, but due to the population, three districts are needed rather than two. Toronto and it's neighbouring regions, York, Durham, and Peel, become a central riding, while the remainder of Ontario is divided into North East and South West.
Like my earlier post on STV, I want to examine what an election would look like under this system.
Using D'Hondt, we get the following results:
NL:
6 - LIB - 165,418
1 - NDP - 54,120
0 - CPC - 26,469
0 - GRN - 2,772
PEI:
3 - LIB - 51,002
1 - CPC - 16,900
0 - NDP - 14,006
0 - GRN - 5,281
NS:
7 - LIB - 324,816
2 - CPC - 93,697
2 - NDP - 85,468
0 - GRN - 17,630
NB:
6 - LIB - 227,764
2 - CPC - 112,070
2 - NDP - 81,105
0 - GRN - 20,551
Atlantic Subtotals:
22 LIB // 5 CPC // 5 NDP // 0 GRN
MB:
7 - LIB - 268,280
5 - CPC - 224,527
2 - NDP - 81,960
0 - GRN - 18,944
SK:
3 - LIB - 131,681
7 - CPC - 267,937
4 - NDP - 138,574
0 - GRN - 11,527
AB:
9 - LIB - 473,416
21 - CPC - 1,150,101
4 - NDP - 224,800
0 - GRN - 48,742
BC:
15 - LIB - 829,816
13 - CPC - 708,010
11 - NDP - 615,156
3 - GRN - 194,847
Western Subtotals:
34 LIB // 46 CPC // 21 NDP // 3 GRN
After which we get into Quebec
Greater Montreal Area:
17 - LIB - 881,148
4 - CPC - 250,755
10 - NDP - 554,070
8 - BQ - 445,006
1 - GRN - 55,107
Rest of Quebec:
12 - LIB - 636,525
9 - CPC - 456,638
10 - NDP - 521,296
7 - BQ - 379,138
0 - GRN - 40,288
Quebec Subtotal:
29 LIB // 13 CPC // 20 NDP // 15 BQ // 1 GRN
And into Ontario
North East Ontario:
15 - LIB - 835,201
12 - CPC - 633,213
5 - NDP - 304,078
1 - GRN - 62,853
South West Ontario:
15 - LIB - 809,235
14 - CPC - 801,147
7 - NDP - 405,389
1 - GRN - 68,854
Greater Toronto Area:
26 - LIB - 1,286,957
17 - CPC - 865,033
7 - NDP - 376,449
1 - GRN - 54,285
Ontario Subtotal:
56 LIB // 43 CPC // 19 NDP // 3 GRN
Nationwide Total:
141 LIB // 107 CPC // 65 NDP // 15 BQ // 7 GRN // 3 from the Territories
You'll notice I didn't mention a threshold; that's because there is none. The size of the districts act as their own threshold. The largest one has 51 members which puts an effective threshold of around 2%. This means none of the parties last-time that did not win seats, would win seats under this new system.
Compare our result above to an absurd nationwide list:
135 LIB // 109 CPC // 67 NDP // 16 BQ // 11 GRN // 0 Libertarians
Despite the fact the Libertarians were the next most popular party, despite the fact I am using no threshold, they win 0 seats. In fact you'd need to expand the commons to 473 seats before they win a seat. You can check for yourself here. (presuming the link lasts)
One reason the Liberals do better under the regional system is how strongly they won the Atlantic, which is given more seats than its population would otherwise grant.
So what of this system? It's very unlikely we'd ever get it; given that it eliminates local representatives. However, in short, it would distribute seats based on the proportion of votes. That means an end to majorities.
There is not much more to say on it. I will, however, examine the other systems that are being looked at in posts in the coming days and weeks.
Thursday, September 22, 2016
Electoral Reform - A sizable proposal
This is a proposal that won't impact the way you vote at all. In fact, it's a proposal for drawing ridings. This proposal is thus only useful if we keep ridings, and as such, is best useful for either ranked ballots or FPTP.
Currently, we have laws in this country that allow northern ridings to have less people than southern ridings. One problem is that the definition of what's northern is unclear, and when it is clear, people often argue about where the line should be.
As such I've developed a solution. My solution fixes that. When it comes time to decide Federal ridings, we shall follow all the steps we do now, right up until you divide all the ridings within each province. Instead of simply dividing all ridings within a province to be equal in terms of population, you make it equal in terms of population and size; by making every 10 SQ KM of physical size, equal to a single voter. The current exceptions would continue in some way. Most ridings would be expected to be within 10% of the average population. Geography can create some weird situations, so as many as 1/10th of every riding in the province can be as much as 20% off the average. Lastly, should any single riding be in "extraordinary circumstances" in a province, the commission redrawing the boundaries may set that riding as much as 50% off from average. Remember though, all those averages include the 'phantom electors' that are added due to the size of the riding.
You may think that this means that urban ridings will be crowded while rural ridings in farming areas will only have a few dozen voters, but that does not properly understand the size differences in ridings.

Flamborough—Glanbrook which is #21 on the map, is 941 SQ KM in size. This means 94 'voters' would be added to the riding before calculating if it's the proper population, or if it is too large or small. Compare this to #61, Toronto Centre, which is under 10 SQ KM, meaning only 1 'voter' gets added. For Flamborough, this would increase the population of that riding from 97,081 to 97,175, or a change of 0.1%

Haliburton—Kawartha Lakes—Brock, #12 on the above map, is under 9,000 SQ KM in size. If you had added this as a population would add 900 residents, which would bump the quote from 3.74% above the average to 4.51%, a very minor change. Compare this to the Algoma riding, #01, which is over 100,000 KM SQ in size, which would add 10,000 people to the population of the riding, or the Kenora riding, #16, that would add 32,000 voters due to it's size.
Compare as well to provinces elsewhere. In Manitoba the Churchill riding, on it's current population and it's new area population, would have ranked at 134,000 people, and as such, been very over-populated. This means northern communities like this would be far better represented.
In general, as a result of this, you'll only see a minor shift northward of ridings. Most provinces already properly under-populate their northern ridings. Where this will matter is in parts of Northern Ontario. The native communities in Northern Ontario often feel under-represented, and this is, in part, because areas like Sudbury, Thunder Bay, and Sault Ste. Marie, are comparatively over-represented. This proposal would shift ridings within Northern Ontario further north, while pushing ridings in areas like Sudbury slightly to the south. Northern Quebec would also see a massive change; while most ridings in the province wouldn't see a change, the massive northern riding would be split in two. This is important, again, for the native community, as they are spread over the massive area of this riding, and, would get their own riding. Contrast this with the current riding, where the majority of voters live in the southern 'bulb' hanging off the south end of the riding.
Not as well that I still give the option to go as low as 50% or as high as 150% due to extraordinary circumstances. Part of the reason for this is that Labrador, even with the area adjustment, would be beyond 25% of the quota. I see no reason, at this time, to remove Labrador as it's own seat.
This is based on an idea from Australia, where rather than 1 person being added for every 10 SQ KM in size, the state of Queensland adds 1 person for every 50KM in size, and only if the seat is over 100,000 SQ KM in size. Canada is much more willing to allow it's physically larger ridings to be smaller in terms of population, and part of the reason for this is due to our friend Joh Bjelke-Petersen and the manner in which he over-represented rural farming areas as a method to stay in office.
I feel that this proposal is a fair and simple way to enshrine in law a current regulation that is unclear, and a simple way to ensure that such representation principles are less associated with any 'where is the line' controversy that may erupt.
Wednesday, September 21, 2016
Labour Leadership - UK
Today is the day the UK Labour party picks it's next leader.
All signs point to Jeremy Corbyn, the sitting Leader, will be re-elected. Corbyn is popular with the left, and the Labour party has grown among the left in recent years. The party, at one time, had around 200,000 members. This was true during the Blair years. There is evidence that these people, who still support Labour, are strongly anti-Corbyn. However, they are outvoted by the 400,000 or so people who have joined the Labour Party in the past 18 months. While this brings Labour back to levels they saw in the past, it also means there is a real possibility that Labour could return to the sort of party they were under Michael Foot; a left-wing party that is unable to beat the governing Tories.
There isn't much more to say at this time. Perhaps if Corbyn somehow loses, I may do a further update, but all signs point to a healthy win with between 60% and 80% support.
Tuesday, September 20, 2016
Looking to the past for a Trump analogue
The question of what might happen if Trump wins comes up often. There are a range of opinions from the literal nuclear annihilation of the world, to nobody even really noticing because so little changes.
I want to take a look at the life of three men, Huey Long, Maurice Duplessis, and Joh Bjelke-Petersen, as possible examples of what a Trump government might do. All three lead sub-national governments; Louisiana, Quebec, and Queensland, and all three were famous for their 'iron fisted' control over said governments, and similar approaches to repression towards anyone who did not fit their view of the 'norm'
Long was first elected as Governor in 1928.
Long was accused of having ties to the KKK, but at the same time, Long could be seen as a progressive, demanding to "share our wealth" with everyone. This is something that happens often with those on the far right, they wrap around the political spectrum, and pop back out on the far left. Political platforms of racialist parties often do have very left-wing policies in terms of social support. This is often combined with the fact that uneducated poor white people are often the base of support for these candidates and parties.
Long not only obtained a stranglehold over state politics while Governor, but he continued to hold it after being elected a federal Senator. Long was often called the closest thing that the US has ever seen to a dictator. One thing done during this period was the weakening of the office of the mayor of new orleans. This is one of the things that is often done by those who wish to crush opposition, by using government power to weaken their democratically elected opponents due to different levels of government.
Long's power was behind the scenes. There certainly was clearly sketchy things done within the press and in legislation, but most of what was done was using regulation and the powers of the executive. This can be seen in decisions as to who to hire, or contract with. This is the much more traditional "corruption", but tinged with heavy elements of ideology. As an example, such a government would hire their ideological friends rather than someone who they disagree with but who could line their pockets with money.
Long died in 1935.
A year later, in 1936, Duplessis was elected Premier of Quebec.
His connections to the Catholic Church are well known, and in fact, it was during this period that the church was seen as opposing the Liberals, implying that Red, the Liberal colour, was also the colour of hell.
One famous piece of legislation made it illegal to disseminate "communist propaganda". Of course, it failed to define exactly what "communist propaganda" is, nor did it allow for a presumption of innocence. It is exactly these kind of law that allow for abuse of power. After all, if you have the power to decide that anything is against the law, what is to stop you from deciding the people you personally dislike happen to own all those illegal things? Thankfully for the majority of citizens in Quebec, the answer was the ethics of the powers that be, but this was not the case for everyone.
Perhaps the biggest difference between Duplessis and Long was that Duplessis was strongly opposed to progressives. He did what he could to develop rural areas, at the expense of urban areas. Duplessis motivation for trampling the checks and balances was to support his view of "tradition" and the existing pro-catholic culture in Quebec.
Duplessis' strength came from his control over legislation, planning, and the official powers of government. While there certainly was a press strategy and movements behind the scenes, much of the 'control' came from the legislature. This made Duplessis' control much more 'visible' than that of Long, and represented an alternative strategy to achieve, in some ways, the same ends.
Duplessis died, from a stroke, while still Premier, in 1959.
Joh Bjelke-Petersen already had a seat in the Queensland legislature by then. Two years earlier, his party had won government, and in 1963, Joh became a Cabinet Minister. By August of 1968, Joh was Premier of Queensland.
Joh lead the Country/National party in Queensland. Normally, in Australia, the Nationals were second to the Liberals. Both parties, being right-wing, sat in a permanent coalition, weather in government or opposition. Queensland, however, was different. Most states had great concentration of populations around the capital. Consider that here in Canada, Toronto and Montreal are heavily dominant in terms of population. Compare this to Alberta or Saskatchewan, where the largest city is not so dominant, or New Brunswick, which is very diffuse. Queensland, while not quite as diffuse as New Brunswick, nevertheless allowed the Nationals, which were always stronger outside that main central area of population, to do very well. As such, Joh, while Premier, lead a coalition with the Liberals.
Joh is famous for his political maneuvers. The National party has always been a bit more right-wing and conservative than the Liberals. Joh governed from the right, and purposefully risked his coalition with the Liberals on many occasions. When the Liberals finally had enough, they broke the coalition in 1983, Joh ran for his own majority, and after a couple of Liberal defections, he achieved it. This allowed him to govern from even further to the right.
When police were caught on TV assaulting a protester by hitting her on the head with a baton, Joh gave them a pat on the back. The protesters, enemies of 'order', were the bad guy. This plays well because the majority of people who vote have never taken a part on any mass demonstration of this sort. They can not identify with the protester, but they can identify with fear. Who is it they fear? Not the policeman, who is their neighbour, their friend, but with the protestor, who is behaving in a way that seems incomprehensible.
Joh's control was in the press. While he did not force opposition off the air, his strategy was one of a showman. Joh used television to gain control not of the executive machinery, not of craftily devised legislation, but to gain control of society and the voters themselves.
By December 1st 1987 the pressure became too great, and Joh stood down as Premier.
Since then, there have been other politicians and parties have have proposed these sort of nativist policies. Donald Trump fits in well with this group. So where does Trump fit in?
Of the three presented above, Trump is most like Joh Bjelke-Petersen. In some ways, Trump is also similar to Margaret Thatcher, and different from Ronald Reagan. Trump's view, to summarize, is that there are two kinds of American. A "Normal" American, who has a job, a family, watches lots of television, and is probably white, and an "Abnormal" American, who sticks to strange traditions, spends their time protesting, and gets all their news from online sources.
This does not provide us with our final answer, but, does provide vital background information to this question.
Monday, September 19, 2016
USA: Week 3
Trump is on the move. His poll spike from last week has managed to remain, which is not all that unusual at this point in the election. This is when voters on both sides start to engage, and specifically, start to see the things in their opponents that they dislike. Meanwhile, the centrist moderates begin to plug in, but remain undecided.

As you can see, this may well not be enough. Even with Ohio, Florida, North Carolina, Nevada, and Iowa, Trump still trails in the electoral vote. This is even after you add in the 1 possible seat in Maine he may win due to Maine's split EV electoral system.
Not much commentary at this stage, it's still early, but it is quite possible this will be the high point for Trump; but it is also possible this was simply the indication that Trump would win. The update next week may not be very different either.
Bonus - Russian Election, count nearing completion.
FPTP seats - PR seats - Total seats
203 - 140 - 343 - UR - Putin Conservative
7 - 35 - 43 - CPRF - Soviet Communist
7 - 16 - 23 - JR - Social Democratic
5 - 34 - 39 - LDPR - Ultranationalist
3 - 0 - 3 - Others:
1 - Rodina - Far Right
1 - Pensioner - Social Conservative
1 - Civic Platform - Liberal
This will be my final post during the count. I may do a post later in the week, but not for days.
If the trend continues, the 'other' parties may continue to drop leads in their individual seats. Putin's party seems to be stable, winning 203 of the 206 seats it decided to contest. If possible, I'll get to get details for the 3 ridings they failed to win for a later post.
Sunday, September 18, 2016
Bonus: Russian Elections
Just a heads up; anyone who wants to track the results can do so by looking at the official results from the election commission. You can use the graphic in the previous post to help associate which parties are which.
http://www.cikrf.ru/vote/img/itogi_mesta.jpg
This is the results of the individual constituencies, showing 1st place (IE wins) 2nd placed and 3rd placed finishers.
http://www.cikrf.ru/vote/img/itogi_federal.jpg
This is a summary of the nationwide vote for the proportional list. The proportion of vote has not changed very much from when I last posted.
As such, the current numbers look roughly like this:
335 - UR
44 - LDPR
44 - CPRF
22 - JR
5 - Others
Bonus: Russian Elections (and berlin)
A bonus post; meaning a post on a day where I've already made a blogpost somewhere.
First a quick update on Berlin; where the SDP seems poised to enter a coalition with the Greens and Left, after it's coalition with Merkel's CDU has failed to gain a majority, in part, due to the hard-right AfD entering the legislature.
In Russia it seems I've erred. I've under-estimated the impact of a change of the voting system. Of the 225 seats that have been changed to FPTP, Putin's party has done extraordinarily well.
In the PR seats, on current vote totals, with 28% of the vote counted, these are the results:
133 - UR
38 - LDPR
38 - CPRF
16 - JR
It's in the individual FPTP seats where things get interesting.
193 - UR
6 - LDPR
6 - CPRF
6 - JR
5 - Others
I will be delving deeper into these results to see exactly what this means. Important is Yabloko, the "Apple" party, is set to win a seat. They are unabashedly pro-west and pro-democracy.
edited to add
results graphic, updated results:
Japan: update
The next Japanese election is at least 2 years away, but there have been some developments that may be of interest.
Japan's Democratic Party has chosen a new leader, Renho Murata. Renho is notable in that not only is she a woman leading a major party in Japan, but she is only half Japanese, as her father was from Taiwan. Japan has had a female leader of the opposition before, but it is extraordinarily rare for anyone who an immigrant, or a child of an immigrant, to rise in Japanese politics. So rare that when it does happen, it becomes famous for simply happening.
Renho will lead the Democratic Party, a successor to the Democratic Party (into which the Liberal Party merged) which was itself is a successor to the Democratic Party. The party leans slightly to the left on social issues. The main opponent of the Democratic Party is the Liberal-Democratic Party, created in 1954 by a merger of the Democratic Party, and the Liberal Party; which itself was created from a merger of the Democratic Liberal Party with the Liberal Party.
The LDP is the current government lead by Shinzo Abe, and leans to the right. Perhaps the biggest difference between the parties is they are shifting, slowly but surely, towards the directions of the 'new' right and left dichotomy. While the LDP backs free trade, some of their policies can be compared to that of Donald Trump, even if those commonalities are limited in number. The DP meanwhile, as exemplified by electing a half-taiwanese female leader, is much more 'global' in it's view, and behaves in a way more common to parties in the western world, while the LDP has much stronger tied to "tradition" in the traditional Japanese manner. Polls indicate that the LDP has a strong lead going into the next election.
However, polls in Japan are difficult to read. If you read polls going back to 1998 you'll notice a trend in most; they are woefully under-estimate opposition support.
A poll in June of 2000, the time of an election, indicated LDP support at 28.1%, which may seem low. This is because half of all respondents tell pollsters they back "no party" at this time. As such we can roughly double our numbers to correct for this. The LDP would thus be sitting on 56% of the vote, compared to a rough 16% for the Democrats. The real election, however, saw the LDP take 41% in the constituencies, and the DPJ take 28%. It gets even worse as in the Proportional seats, the LDP took 28% to the DPJ's 25%. November 2003 hit closer to the mark, but still under-estimated opposition support. This repeats again in September 2005. In August 2009, the opposition actually won the election, and it was the first time polls were accurate in any meaningful way. In December of 2012 the LDP won government back, and the polls, again, were useful... but only for the top two parties. Polls woefully under-estimated support for a 3rd party, and were still far off the mark in terms of PR support. The old trend returns in december 2014, with polls suggesting the DPJ would take 1/4th the support the LDP did, when they actually took half.
This is when I remind people that Political Science, despite the name is, an art, not a science. As such I have no hard number I can give you, only to tell you that you must increase the support for the opposition parties if you want to get any sort of accurate election prediction from Japanese polls.
This brings me to recent polls that show the LDP on 40%, and the DP on 8%, with 40% of voters providing no party support. Given the history shown, my current election prediction would be as follows:
285 - LDP
100 - DP
40 - JCP
35 - Komeito
15 - Others
Komeito sits in coalition with the LDP, and the JCP for those who don't know is Japan's Communist Party.
This would be a loss of 5 seats for the LDP compared to what they currently hold, and a gain of 4 for the DP, while Komeito would hold steady. The JCP would be the big winner, nearly doubling their seat count and capturing their largest number of members ever. This is due to the fact that no other opposition party exists for those who dislike the DP to vote for. While there are small parties, they are polling so poorly that even a combined 15 seats may be optimistic. The JCP itself is not much more radical than the Czech Communists; though comparing two parties a continent away is always difficult.
Should the above come to pass it would mark a possible return to 'stability' in Japanese politics. It may be that any future DP governments will lack the ability to obtain a majority, in which case they would need to rely on the JCP for support. If so this would create an effective "Two Coalition" system where voters are given a clear choice on which coalition will govern them.
How this all plays out remains to be seen.
Friday, September 16, 2016
State of the provinces - Fall 2016
I do these every so often, a little 'state of the provinces' look at how politics is across the country. In it, I examine legislatures in all provinces, and the parties that fill them up. I also usually take this opportunity to look at the Federal houses, and parties as well.
Newfoundland and Labrador
30 - Liberal
7 - PC
2 - NDP
1 - Independent
All parties have permanent leaders. The Greens are not a registered party provincially.
Prince Edward Island
17 - Liberal
8 - PC
1 - Green
0 - NDP
1 - Vacant
The PC Party are having leadership elections. The NDP currently has a permanent leader but that could change.
Nova Scotia
34 - Liberal
10 - PC
7 - NDP
0 - Green
1 - Independent
All parties have permanent leaders. The Greens are small and could be at risk. The most recent change was an NDP by-election victory.
New Brunswick
26 - Liberal
22 - PC
1 - Green
0 - NDP
The PC Party is having a leadership election. There have been repeated attempts to create a 5th party on the right in the province, and a party that somewhat represents this, currently does exist.
Manitoba
40 - PC
14 - NDP
3 - Liberal
0 - Green
The NDP and Liberals are having leadership elections. Like New Brunswick there is some very limited and weak history of a 5th, more right-wing party here.
Saskatchewan
50 - Saskatchewan
10 - NDP
1 - Independent
0 - Liberal
0 - Green
The NDP and Liberals are having leadership elections. The Greens small and at risk, and are also having a leadership election. The most recent change was when a Sask Party member was charged with drunk driving and left the cabinet to become an Independent.
Alberta
54 - NDP
22 - Wildrose
9 - PC
1 - Liberal
1 - Alberta
0 - Green
The PC Party and Liberals are having leadership elections.
British Columbia
48 - Liberal
35 - NDP
1 - Green
1 - Independent
0 - Conservative
The Conservatives are having leadership elections. The Green Party is at risk due to instability in the federal party, it's leader has mused about changing the party's name.
BC goes to the polls in the spring.
Quebec
70 - Liberal
28 - Parti Quebecois
20 - CAQ
3 - QS
4 - Vacant
0 - Green
The PQ is having leadership elections. The Greens are small and at risk.
The PQ leadership election ends within a month. Alexandre Cloutier is currently expected to win.
Ontario
57 - Liberal
29 - PC
20 - NDP
1 - Vacant
0 - Green
All parties have permanent leaders. The most recent change was a PC by-election victory.
Yukon
12 - Yukon
6 - NDP
1 - Liberal
0 - Green
All parties have permanent leaders. The Greens are small and at risk.
Yukon goes to the polls this fall. The election call will come before October 24th, and may come at any time. It's unclear who would win the election, but some indications suggest the Liberals would do well.
Senate
41 - Conservative
21 - Liberal Senate Caucus
23 - Independent
20 - Vacant
Conservatives continue to sit in a united caucus with their fellow party members from the House of Commons.
House of Commons
182 - Liberal
97 - Conservative
44 - NDP
10 - Bloc Quebecois
1 - Green
1 - Independent
3 - Vacant
The Conservatives, the NDP, and the Bloc are holding leadership elections. One Conservative member, Jason Kenney, is expected to resign shortly. Recent changes include the resignation of Stephen Harper, Conservative, the death of Mauril Belanger, Liberal, and the resignation from the party of Hunter Tootoo, Liberal. The leader of the Green Party is at potential risk due to internal instability.
As a side note; this post comes along with a sister post, posted earlier (at the time I wrote this) on my personal blog.
Thursday, September 15, 2016
First Poll
The UK has a different way of counting ballots than we do here in Canada. All the ballot boxes are brought to a central location and counted there. What this means is that once the count is finished, all the ballots have been counted. For this reason, candidates attend these counts, and once these counts are complete, the returning officer announces the final result, and the winner. Unlike here, there is no time to verify the ballots, as, they are verified on the night. The up side is that the final result, after recount, is known by the next morning, but the down side is that it is often 3 hours or more after the polls close before results start coming in, whereas in Canada, 3 hours after the polls close we usually have our final result.
The biggest problem with our system is that since we count each box independently, there is a chance the first poll does not indicate the final winner. This got me thinking exactly what chance this is. As such, I set out to re-watch historic elections and take notes.
This did not turn out the way I wanted at all. After watching both CBC and Global coverage it quickly became apparent that not every riding's first poll gets reported in time. By the time certain ridings get reported on, we are as many as 10% of the polls in, or more. For this reason, doing this on a Canada-wide scale for other elections in the same way I've done for 2015 is simply not logical or useful. However, I will see what I can do in terms of comparing those few ridings that actually are reported with just 1 poll to the final result for as many elections as is possible.


To create this map I had to use various sources, including both TV network's "rolling results" bar, the riding focus graphics, mentions, and the actual maps they showed on-air. As such, it's very plausible that a first poll came in for many of these ridings that simply was missed by me.
The best way to get these results would be during a live election, since with the internet, you have access to all these results. However, failing that, I have a few conclusions:
Certain things are dependent on certain variables.
Even in the best cases, you can expect a 10% error.
In the worst instances, you may have a 50% error.
So what variables are we talking about? One is how close the race is. The closer things are the higher a chance the first poll will be inaccurate. Since the media likes focusing on close races this means there is an increased chance that if you are listening only, you'll get a high error. This means radio coverage and their focuses would be the most iffy. Watching on TV however, their focuses seem closer to 33%. The rolling bar however has a lower rate, as low as 10%, but that bar also can show result only after a few polls are in.
As such I've developed a quick guide. Roll a die. If it's a 1, the result is wrong. If they make a big deal about how close the race is expected to be, if it's a 1 or 2, it's wrong.
While this won't be a crystal ball, in terms of the odds, it's a good bet that you'll be in the general area of correct.
This is interesting to me, and as such, the next time we have an election here in this country, I will be keeping track of this information live, and produce a figure after each election. Hopefully after a few solid results, we can produce a reliable figure for exactly what the odds are that the first poll indicates the winner.
The biggest problem with our system is that since we count each box independently, there is a chance the first poll does not indicate the final winner. This got me thinking exactly what chance this is. As such, I set out to re-watch historic elections and take notes.
This did not turn out the way I wanted at all. After watching both CBC and Global coverage it quickly became apparent that not every riding's first poll gets reported in time. By the time certain ridings get reported on, we are as many as 10% of the polls in, or more. For this reason, doing this on a Canada-wide scale for other elections in the same way I've done for 2015 is simply not logical or useful. However, I will see what I can do in terms of comparing those few ridings that actually are reported with just 1 poll to the final result for as many elections as is possible.
Regardless, here are the maps showing the earliest result available in each riding in the 2015 election:


To create this map I had to use various sources, including both TV network's "rolling results" bar, the riding focus graphics, mentions, and the actual maps they showed on-air. As such, it's very plausible that a first poll came in for many of these ridings that simply was missed by me.
The best way to get these results would be during a live election, since with the internet, you have access to all these results. However, failing that, I have a few conclusions:
Certain things are dependent on certain variables.
Even in the best cases, you can expect a 10% error.
In the worst instances, you may have a 50% error.
So what variables are we talking about? One is how close the race is. The closer things are the higher a chance the first poll will be inaccurate. Since the media likes focusing on close races this means there is an increased chance that if you are listening only, you'll get a high error. This means radio coverage and their focuses would be the most iffy. Watching on TV however, their focuses seem closer to 33%. The rolling bar however has a lower rate, as low as 10%, but that bar also can show result only after a few polls are in.
As such I've developed a quick guide. Roll a die. If it's a 1, the result is wrong. If they make a big deal about how close the race is expected to be, if it's a 1 or 2, it's wrong.
While this won't be a crystal ball, in terms of the odds, it's a good bet that you'll be in the general area of correct.
This is interesting to me, and as such, the next time we have an election here in this country, I will be keeping track of this information live, and produce a figure after each election. Hopefully after a few solid results, we can produce a reliable figure for exactly what the odds are that the first poll indicates the winner.
Wednesday, September 14, 2016
International and a unique project
Belarus
Belarus is not a free democracy and all indications was the election would be identical to the last;
110 - Pro Government
0 - Opposition
Much to my surprise, I'm delighted to report that has not occurred. The results are as follows:
108 - Pro Government
2 - Opposition
This is unexpected. Belarus is also a very repressed country so I really have no other information. Regardless it's good news, and hopefully, these 2 members will be allowed to serve out their term alive and well.
Croatia
Not much has changed in seat counts, which are as follows
61 HDZ (Conservative)
54 SDP (Social Democratic)
13 Most (Fiscal Libertarian)
13 Others
This is a gain of 2 seats for HDZ and a loss of 6 from Most (which means Bridge in Croatian) who had a 'coalition' of sorts in the last Parliament that barely lasted a year.
I think the 'message' here is that Most was too fussy in coalition, and HDZ members would agree. The Coalition was always a bit strained. Given the numbers, the most logical result is another coalition but with Most having it's wings clipped, they'll be far more willing to bend.
Russia
September 18th is election day. I did a preview of the election earlier, and wish to provide an updated prediction. Changes from last election indicated.
268 UR +30 (Regime, Conservative)
78 LDPR +22 (Nativist, Nationalist)
62 CPRF -20 (Communist, Dictatorial)
42 JR -32 (Social Democratic)
42 JR -32 (Social Democratic)
Based on polls, which may not exactly be accurate.
Announcement
While you are reading this I will be watching the 2015 Canadian election over again, from the starting gun to the end of coverage. Why? Well I enjoy that sort of thing; it is always fun to rewatch coverage of an old election to see what people are saying. Contemporary thinking is always interesting in hindsight. While watching the election I will be doing something that, from what I know, has never been done before. I'll be keeping track of what the first poll to report from each riding has said. I'll be posting a map as well to show what those first polls indicated.
This is where I'll need to make another decision. I have access to some results programs of past elections through various (mostly american) online resources. If, and that's a big if, I do not find the work to do this too taxing, I will go back and do this for every election that I can. It may turn out that this work is too taxing; that I find it too hard to keep track of all these results while watching hours and hours of coverage for an event that I know the ending to. However, it is my hope that I will not find it that taxing, and, as a result, be able to produce such results for many elections.
If this all works, the end result will be a rock solid number that I can give you that will indicate, clearly, the chance that any single poll on election night, in fact, indicates the winner.
Tuesday, September 13, 2016
More STV; Ridings in Quebec, Ontario.
I've chosen two ridings, Saguenay and 'Quebec' on the map. While the Greens do run in Quebec, they tend to do poorly in most areas. In fact, the Green vote in Quebec is concentrated in the english parts of Montreal, where, in some radical cases, they can be the 2nd largest party. As such, I will ignore them in this examination, which is in francophone areas. The reason I've chosen these two ridings is that these are two areas where all the 4 major parties in Quebec are competitive. While the Tories have not run ridings in 'Quebec' in quite a while, they do perform well in these areas. Well enough that in a 4-seat riding it's quite possible, if not plausible, that they could walk away with 1 of those seats. In Saguenay the 4 party balance is even closer, and the reason I've chosen this riding is to show how the number of seats can be crucial. Saguenay's population and it's geographic distribution are very friendly to a single multi-member STV riding. The population is pooled far enough away from anywhere else that expanding this riding is unpalatable. The entire saguenay area is an area on to itself, and as such, 3 members just makes sense. This puts pressure on the 4 parties, as if each party only runs 1 candidate (and they would) whichever candidate finishes 4th, simply does not win a seat. Should a party risk running 2 candidates, they risk seeing the other 3 elected while their candidates split the vote.
This is the strategy that you will see within STV. How many candidates to run, how to divide them within the riding to properly manage the vote, and even to some degree, what sort of 'deals' to make with other parties. What if, for example, the NDP, knowing they might find a difficult race in Saguenay, approached the Greens. What if the NDP said "hey, we know you are having some problems winning in Vancouver. You always come close, but you just don't quite clench it. If you'll withdraw from Saguenay, we'll only run 1 Candidate in Vancouver, and urge our supporters to rank you #2." To the public the NDP can simply say that they only think they can win 1 seat in Vancouver, and that if the Vancouver NDP thinks the Greens should be preferenced #2 their's their business.
These are the sorts of things we may see if we go down the route of STV (which is looking more likely)
Lastly, I want to look at the "Ontario" riding. You'll notice it's a very strange shape. Guelph is within it, but a small portion of another riding is between it and the remainder of the riding. Despite that, the riding actually makes sense given commuting patterns. Guelph is 'closer' to Kitchener and Waterloo than it is to Burlington and Oakville, while the riding that surrounds it is centered around Georgetown, which most certainly is closer to Burlington and Oakville than it is to Kitchener and Waterloo.
That aside, the reason I've chosen this riding is the Greens. In the last election, Gord Miller ran in Guelph, and there's no question that a "star" candidate like him would have been the only candidate in a STV riding.
The important thing is we are talking about a 6 seat riding. Arguments like "I can't vote for you because you can't win" become moot. As such, you can expect to see the Green vote increase significantly in areas like this, where they, in fact, can win. The simple existence of ridings like this is reason to expect the Greens can, and will, win more seats. Had this riding existed in the last election, I have no doubt that Gord Miller would have been elected as an MP. With STV and the transfer of votes, it becomes likely that NDPers, in an effort to stop either Liberals or Conservatives from winning, would preference the Greens well.
Due to the existence of 'dead' votes, it's likely the race for the final seat in many ridings will see three candidates, all below the threshold. In these cases, whoever is last, becomes the kingmaker.
Regardless, I hope that this has been a helpful look at STV and how future elections might be run. It's gone on far longer than I'd thought it would. In the future I do plan on examining specific races in Ireland to show as an example for how 'non obvious' things might happen. Until then, I'll leave you with this thought; every system has complex things, including FPTP. The only difference is we are exchanging one set of complexities for another.
More STV
Of the other ridings named, I want to start by addressing the "PEI" riding, as this is the shortest. We'll end up with a single province-wide riding. This means the threshold for winning a seat is 20%+1. One thing to keep in mind when you look at real STV results is that 100% of voters do not always stay within a party. In the 2015 election, the Liberals did extremely well. Normally we see a more balanced result. Lets make up a fake future election based on that. This is what we may see in a future election.
I will presume 84,999 ballots cast, a reasonable number for PEI. This places the threshold at exactly 17,000.
In elections where one party does very well, we could see one of the main parties (Liberal, Conservative) running 3 candidates, but outside of that, we are far far more likely to see each only run 2. The NDP is smart to only run 1, as are the smaller parties. In the last 5 elections, the CHP has run, and in the election before that, the CHP candidate in 4 of those 5 elections, ran as an Independent, due to registration problems. As such I will be using the 4 national parties, and the CHP in this example. I will use names from the 2015 election for the names of candidates, though no guarantee any of these people will want to run for another term.
Here is a possible result.
17,181 - Easter - L ELECTED
17,094 - Shea - C ELECTED
16,838 - Pataki - C
16,822 - MacAulay - L
13,263 - Cann - N
3304 - Viau - G
497 - Squires - H
you may wonder how exactly the main parties manage such quality vote management. There are a few ways to do this. You could tell everyone born on an odd numbered day to vote for one and everyone even for another. You could ask everyone with a name that start with A-M to vote for one, etc etc, but the most logical way, and the usual way parties do this, is geographically. The Liberals, in this example, would likely have said something to the effect of "If you lived in the ridings of Egmont or Malpeque, vote for Easter, and if you lived in Cardigan or Charlottetown, vote for MacAulay." This could produce a result like what we see. Had the Tories done the same they would have been more imbalanced, so they could fix this by asking everyone living in Charlottetown, Winsloe, and on or east of Winslow Road to vote for Pataki, while asking anyone who lived east of Charlottetown, and on or east of Rustico Road to vote for Shea. This means that in general, voters are considering either Easter/Shea or MacAulay/Pataki, but that some voters in the Brackley/Stanhope area, are considering Easter/Pataki. The ability of the parties to pick a dividing line is what makes this work. Parties that pick the right dividing line do very well indeed, while picking the wrong one, will leave you terribly unbalanced. However, lets look at how this would play out.
First we start at the top. We distribute Easter votes.181 of them. Most of them, lets say 150, will go straight to MacAulay. So what of the other 31? Well 10 of these folks are voting for "progressives" so they voted NDP second. 8 of them liked Easter in cabinet, but also liked Shea in cabinet, so they voted for her. 6 of them care about the environment, so they voted Green. 4 of them have met Easter personally, as well as Pataki, and like them both, so that's where they go. 2 of them consider themselves Christian, so go CHP. And 1 of them really don't like any politicians except Easter, on the grounds that they are related, he's 18, and was pressured to vote, so they did not rank anyone else. This becomes, effectively, a dead vote.
17,000 - Easter - L ELECTED
17,104 - Shea - C ELECTED
16,972 - MacAulay - L
16,842 - Pataki - C
13,273 - Cann - N
3310 - Viau - G
499 - Squires - H
1 - Dead
Now we distribute the 104 Shea votes. Much like above, all of them have a host of different reasons for voting how they did. A few of them voted Shea #1, and Easter #2. With Easter eliminated due to winning, those votes need to go to their #3 choice. As such, the 3rd round looks like this:
17,000 - Easter - L ELECTED
17,000 - Shea - C ELECTED
16,977 - MacAulay - L
16,929 - Pataki - C
13,276 - Cann - N
3315 - Viau - G
502 - Squires - H
2 - Dead
After this we need to eliminate the last placed candidate. However, many people voted CHP precisely because they didn't like the other 4 parties; as such, this may well be the next round:
17,129 - Pataki - C ELECTED
17,004 - MacAulay - L ELECTED
17,000 - Easter - L ELECTED
17,000 - Shea - C ELECTED
13,296 - Cann - N
3325 - Viau - G
247 - Dead
With 4 candidates elected, the count ends.
This is the last time I directly look at counts. In a few hours, more ridings.
STV, some specific examples.
I've taken the idea of "Urban PR" and expanded it. One reason that it was popular on the Prairies is just how gosh darn big those Prairie provinces are. Ontario's "rural" ridings (not it's remote northern ones) are tiny compared to the average "rural" riding from Western Canada. As such I've only taken the largest ridings out, and have lumped everything else together into multi-member STV ridings. Here is the map:


You'll notice some ridings have names in ALLCAPS written in or beside them, these are ridings I will be using for my examples. You'll also notice white ridings; these ones are the ones that are unmerged. The coloured ridings are the ones that will now be represented by STV. You may wonder why some "remote" ridings are lumped in. A great example of this is ridings lie BC's Mission-Matsqui-Fraser Canyon, the big dark red one on the BC Map. The reason is the huge majority of this riding's voters live in the small corner stuffed beside the other ridings that are also coloured dark red. This is also why ridings in the Kelowna area are not in this STV proposal, as most of their populations are more spread out. Remember too this is a simplified proposal to use in the first election in 2019, and that the boundaries should be redrawn prior to the 2023 election, at which time, such remote fringes would be cut off from the more urban STV focused ridings, and be given their own single-member riding.
Regardless, I wanted to get right to the examples.
First, lets look at Saskatoon. Here are the 2015 results for the 3 ridings that make up the single Saskatoon STV riding.
Waugh - CPC - 19,166
Trost - CPC - 18,592
Benson - NDP - 14,921
Card - NDP - 14,115
Bell - NDP - 13,909
Donauer - CPC - 12,401
Muggli - LPC - 12,165
Block - LPC - 11,287
Abbott - LPC - 9,234
Pritchard - GRN - 846
Harvey - GRN - 686
Mitchell - GRN - 658
Pankiw - CAN - 271
Hart - LBT - 230
Schalm - RHI - 93
(Note, that "Pritchard" is Mr Brigland-Pritchard, whose last name I've shortened to better fit)
With a total of 128,574 votes, and 3 members to elect, 32,144 becomes the threshold to become elected according to the droop quota. No candidate has that so we need to start dropping the lower placed candidates and distributing their votes to other candidates. Mathematically it's impossible for the bottom 3 candidates, even if their votes combined, to advance, so I'll drop all of them right now. I'm going to assume Pankiw folks and the Libertarians will preference the Conservatives, while the Rhino voters will preference the nearest 'protest' party, the Greens. Since this is just a rough example, I'm going to weight all preferences at 100%, even though that is not realistic, and, will weight all preference flows to the top candidate in terms of votes, or, actually elected MPs. Given this, our second round looks like this:
Waugh - CPC - 19,667
Trost - CPC - 18,592
Benson - NDP - 14,921
Card - NDP - 14,115
Bell - NDP - 13,909
Donauer - CPC - 12,401
Muggli - LPC - 12,165
Block - LPC - 11,287
Abbott - LPC - 9,234
Pritchard - GRN - 939
Harvey - GRN - 686
Mitchell - GRN - 658
Now we find that the Greens, even combined, can't overtake the next lowest candidate. As such, we'll drop all of them, and transfer all of their votes, including the transferred Rhino vote, to the Liberals, as the next weakest party, as to make this count more visually interesting.
Waugh - CPC - 19,667
Trost - CPC - 18,592
Benson - NDP - 14,921
Muggli - LPC - 14,448
Card - NDP - 14,115
Bell - NDP - 13,909
Donauer - CPC - 12,401
Block - LPC - 11,287
Abbott - LPC - 9,234
We can skip yet another step since our rules tell us votes always flow to the top candidate, so we can drop both Liberals at once.
Muggli - LPC - 34,971 ELECTED
Waugh - CPC - 19,667
Trost - CPC - 18,592
Benson - NDP - 14,921
Card - NDP - 14,115
Bell - NDP - 13,909
Donauer - CPC - 12,401
This marks our first elect! Muggli has met the threshold and so becomes an MP. The mark is 32,144, so votes over that get transferred. This means we now distribute 2827 votes to other parties. I'm going to presume that these votes will flow to the NDP
Muggli - LPC - 32,144 ELECTED
Waugh - CPC - 19,667
Trost - CPC - 18,592
Benson - NDP - 17,748
Card - NDP - 14,115
Bell - NDP - 13,909
Donauer - CPC - 12,401
Now things become a bit simpler and more straightforward
Muggli - LPC - 32,144 ELECTED
Waugh - CPC - 32,068
Trost - CPC - 18,592
Benson - NDP - 17,748
Card - NDP - 14,115
Bell - NDP - 13,909
Now we drop both lower NDP Candidates (as just one is not enough to meet the mark)
Benson - NDP - 45,772 ELECTED
Muggli - LPC - 32,144 ELECTED
Waugh - CPC - 32,068
Trost - CPC - 18,592
At this point it's clear each party will elect one member.
Now, I want to address something known as "vote management" Wikipedia provides an excellent example. Let's redo this election with only 5 candidates.
Benson - NDP - 27002
Card - NDP - 26999
Waugh - CPC - 29073
Muggli - LPC - 24429
Trost - CPC - 21071
In this situation, Trost's vote goes to Waugh who gets elected, Benson gets elected from Card's vote, and Muggli also wins a seat, the same as above, however, what if the Tories in this example had better vote management. What if things looked like this:
Benson - NDP - 27002
Card - NDP - 26999
Waugh - CPC - 25073
Trost - CPC - 25071
Muggli - LPC - 24429
Suddenly it's the Liberals who drop first, and as such, do not win a seat. This can be easily replicated if a Second Liberal had run, even using the first example:
Benson - NDP - 27002
Card - NDP - 26999
Waugh - CPC - 29073
Trost - CPC - 21071
Muggli - LPC - 12215
Block - LPC - 12214
For this reason the actual number of candidates a party runs can be crucial.
Saskatoon is also important in that it is a single city. Imagine if Saskatoon had a mayor who was very popular, but a bit of a political rebel. Someone who does not identify with any party. This mayor would almost certainly win a seat under this system even if he only is able to acheive 26% in any part of the city, so long as he is consistent with that level of support across Saskatoon.
I will be examining the other ridings named a bit later, in a post later today.
Monday, September 12, 2016
US Election: "Week 1"
We are a week out from the unofficial start of the election, and not much has changed in terms of events. Oh sure there were minor news stories, but in terms of real game-changers, nothing. Trump has had a bit of momentum, but his momentum seems unfocused, and as such, unable to swing too many states.

There is not much to say specifically about this update, but I want to make something clear about the "odds".
Trump can win this election.
The Republican nominee, no matter who it was, could always have won the election. It was always a possibility. It was, and remains, "possible enough" to make it something that could really happen.
It was the nomination Trump couldn't win. The odds of Trump winning the nomination was below the point of worrying about.
Of course we know from reality that Trump did, in fact, beat the odds and won the nomination. Some people think that means he'll also win the election, as that's more likely, but I'd question when was the last time you rolled two yahtzees in a row?
At this time, Clinton has a large lead where it matters, leading 307 to 231. Even if Florida swung it would only bring things to 276 to 262, still a Clinton victory. Virginia is getting more solidly Democratic, and even North Carolina is more likely to vote Democrat than Ohio.
Still, it remains an open race, and we'll have to see exactly who wins. The only real "news" is that Gary Johnson has failed to break through. It's all but certain he will fail to make the debates, and will likely continue to bleed more support. I'll be talking more about Johnson next week.
Sunday, September 11, 2016
Daily posts; but not always here
As a personal objective, I've set out for myself to make daily posts on my blogs. One problem is I've not always been able to do that, but I do try. This does come with a caveat; my blogs.
As you may know, I have a personal blog I run. It is a place I can deposit my random thoughts, my rants that won't fit on twitter, or just interesting things I've been thinking about. You'll find an assortment of posts there like an examination of native tribes in alternate history, a look at a world where a stargate is real, a newfie joke that newfies might like, and random profanity. My personal blog is a mish-mash of things that I tell people to avoid unless they have a strong stomach, as from time to time, I post highly offensive things there. My commitment to myself is a post on one of my blogs, and so, there may not always be a post here. If that happens, that may be a day where I have chosen to post on my other blog, or it may simply be a day where I've failed in my commitment to myself.
I do have a rough schedule for the coming week. On Monday I will update my US election projection, and will likely continue to do so every Monday until the election. On Tuesday I am working on an examination of electoral reform, in particular, what STV might look like if most, but not all ridings in Canada became multi-member STV ridings. Think of it as like a version of "Urban PR" where the definition of 'urban' is very loose. On Wednesday I will look internationally, perhaps with an update on Russia, or an update on recent events in Germany, or coverage of today's election in Croatia; perhaps even all three. Beyond that, I have nothing currently planned, and may make a post on my personal blog, or, may have other interesting things to look at over here.
Saturday, September 10, 2016
Is Kellie Leitch positioning for the leadership of another party?
There have been much written about Leitch and her plans around "Canadian Values", and why she's done it. The leading theory is that by doing this she locks up a huge portion of the Conservative Party; in particular, the socially conservative voter, and to a smaller but no less important extent, those who had backed the Reform Party in the past.
I present an alternate theory.
If you've not read it yet, you may want to give my post about electoral reform a read. You'll note that almost all of the reform proposals would see a new "Reform Party" springing up. My earlier examination of "Urban PR" could even be the best possible system for such a party; which would lock up wins in the rural areas, while getting a few seats in urban areas where they would otherwise win nothing. This becomes far more likely if the rural ridings accept a form of ranked ballot, something that may not be possible if the proposal is to get Conservative support.
Kellie Leitch is one of those people I've had my eye on for a while as a political watcher; she is under-estimated by too many. She has always been quite skilled in the commons and has proven that her ability to politik outside Parliament is equal if not greater.
I thus propose that Leitch has an ulterior motive for pushing so hard at social conservatives.
If Electoral Reform happens, and this does indeed trigger a new "Reform Party", Leitch would be excellently positioned to take charge of that party. Nobody else of stature on the federal level is currently going after this audience, and it most certainly is possible that, if they move quickly, Leitch and a small group of currently Conservative MPs could start such a party. May 2017 is the current timeline for introduction of legislation around electoral reform, which just so happens to be same month the Tories pick their new leader. Legislation needs to be debated, and I for one think that the Liberals will want to pass such legislation prior to the summer break.
This thus gives us our timeline. Leitch purposefully isolates herself on the right among the major candidates. Chong, possibly MacKay, as the 'progressive' faction leader, wins the election, but Leitch places well, perhaps even making it to the final ballot. The legislation drops in early May, and is debated in Parliament. The leader is chosen later in May, after Leitch draws some 'lines in the sand' over issues that she is well aware the party can't support. June will come and the legislation will clear Parliament, and Parliament will break for the summer. Leitch will spring into action, and get together with other MPs, possibly including Brad Trost, Kevin Sorenson, Mark Warawa, and others. This group would then declare their independence from the Tory party, and start a new "Reform Party". While I think it unlikely they'd use the old name, they will be working hard to avoid one thing: the way Reform rose up.
Reform rose up from outside the political establishment to challenge it. This is, in fact, the tradition in Canada. Social Credit, the CCF/NDP, and even the Liberals when they got their start, all rose up from outside the establishment. If this group plans to head off that (and I strongly suspect they would; as this is the first time they may get 'advance notice' of a party creation due to the encouragement of such a thing that electoral reform offers) they will need to move quickly. This means by the time parliament returns in the fall of 2017 (probably with a throne speech) there will be another party. Weather or not they get 12 seats is still in question, but they certainly will have enough to outclass any technical grouping between the Bloc, Greens, and Independents. Nor will the party have enough seats to challenge the NDP for the 3rd position. They'll nicely slot into the #4 spot.
All of this, of course, depends on a great number of variables and assumptions. It is not a map to the next election, but rather, a possible alternative explanation as to the strategy being used. If it is correct, we might yet see far more from Leitch on the front of social conservatism.
Friday, September 9, 2016
Open question: Why do people trust Trump
A general open question, if you think you may have an answer, please comment on this post. The question is simple.
Why do people trust Trump? Trump scores better than Clinton on some questions of trust, but why is that when there is so much evidence that he says things that are untrue?
Why do people trust Trump? Trump scores better than Clinton on some questions of trust, but why is that when there is so much evidence that he says things that are untrue?
Tuesday, September 6, 2016
A possible joint Basic Income proposal
A quick idea/proposal from me on a possible way Basic Income, or more accurately, a Guaranteed Minimum Income might work in Canada. Due to the fact that we split financial responsibility between the Federal and Provincial governments, there are challenges towards getting any such system up and running.
First some quick background on social assistance funding. Ontario Works (welfare) will give an individual $681 per month, and a couple $1077 per month. A couple with one child under 18 gets $1130, while an individual with two children under 18 gets $1004.
One problem with this is that in places like Toronto it can be difficult to find a place to rent for as little as $681 a month, not to mention buying food after paying for rent. It's also likely that a childless couple could easily share a single bedroom apartment, even if their food costs are double that of an individual.
As such I propose dividing up payments into three groups.
1 - Individuals (over age 18)
2 - Households
3 - Dependents (a sub-set of individuals, includes children)
I propose the "base" amount in all these calculations be $340 a month.
The Federal Government will fund the Household fee, and pay 3 times the base amount, monthly, to all heads of households all across Canada. This is $1020 a month.
Each Province meanwhile will fund both the dependent fee, and the individual fee, the base rate, $340 a month, to all individuals and dependents in the province.
Since each household contains, on average, 2.2 persons, this means the Federal government will be kicking in about 3/5ths of the funds for the program. Additionally, the more 'well off' provinces have larger households, while the 'poorer' provinces, have smaller households, meaning they will pay slightly less for this program.
An Individual living on their own, as head of their own household, will now get $1360 a month. A couple living on their own will get $1700, while a couple with a child gets $2040, the same amount an individual with two children would get.
The reason this would work financially is the same reason that a basic income would work. Ontario Works is supplemented by various other funds. Tax breaks apply to rent paid, a GST credit may be available. In addition to Ontario Works, as well as extra funds to pay for heating in the winter. People in Ontario with children can also receive $113 per child as a "baby bonus". Federally you could also get $533 for having a child as well. All of these programs require people to administrate them, each with their own rules and regulations, and each with their own 'bars' of entry. This new program would eliminate all of them, and replace them with a single united administration of a single fund.
To make this work, the fund would have a 2/3rds exclusive clawback. This means for every dollar you make though other means (IE working) that two thirds of this benefit is clawed back. The exclusive part means this is calculated after any and all other clawbacks, including taxes. As such you can never be 'worse off' for working. This contrasts with a more standard 50% non-exclusive clawback that can often combine with taxes and other clawbacks (such as legally mandated debt repayment) so that working means you have less money.
This would replace all social assistance funding, including pensions (the poorest pensioners would, in general, see an increase under this new system, of about $100-300 a month) The amounts agreed to could always be higher than what I propose, but I strongly recommend against being lower, as the level I propose is already far below the poverty line. These rates must be indexed to inflation/CPI. Once agreed, the Federal and all Provincial governments would sign their agreement, and neither the Federal nor the Provincial governments could ever go below this level. However. Either side could decide to go above this level and provide extra funding at their discretion. The Federal government would also be responsible for fully funding this in the Territories. There would also be nothing stopping either side from retaining certain social programs and thus providing extra funding for - for example - children. Should they decide to do this, however, they would be responsible for funding the program themselves.
Monday, September 5, 2016
US Election; "Writ Drop"
If the US election were held using Canadian standards, today would be the "writ drop", the day the election legally begins. This is when polls begin to get far more accurate and frequent, when media coverage ramps up from it's current level to full (if that can be believed) and the "election season" kicks off.
As such I thought I'd do an "opening" update, showing where things stand as this election "begins"

To be clear about the colours: The darkest shades are states that are "solid" and will not be won by the other candidate. Medium shades indicates states that will probably be won, while light shades indicate states that could flip. Unfortunately, the mapping program, 270towin, does not allow for more shades, if it did, I could show how states like North Carolina are far more likely to switch than Georgia, and just how unlikely it is that Mississippi will switch.
The main purpose for this post is to simply set up this as the ground state; where things are starting, and to serve as a basis for future posts and as a point for comparison.
As of today, there are 63 days to the election.
Sunday, September 4, 2016
The case for Urban PR
After looking at the math, we should look at the politics. As you may have noticed, the Conservatives were over-represented. While the Tories do not win every rural riding, they do win a larger share of rural ridings than they do urban ridings. You may also notice the Greens were under-represented, this is a consequence of the small riding size (only 9 members) meaning that a party needs 11% to win a seat, and the Greens have yet to manage that over a large enough area. You'll also note my note about Simcoe County, which is that the math I've done shows results can be different. These three things are the key to allowing all 5 parties to back this. I will go one by one and examine why each party may, or may not, back this idea.
Proposal
First, we need to be very clear what 'idea' we are talking about. The 'idea' I am proposing is based on something said by Jean-Pierre Kingsley, who pointed out that in the past, many provinces have had a form of PR. When I'd first heard of it, I dismissed it, and disagreed with it; but the more I thought about it, I've started to come around. It's far from my preferred idea, but it's something that I do not hate.
The idea itself is as follows
1 - "Urban" areas containing 3 or more ridings are combined into multi-member ridings.
2 - These "Urban" ridings should match municipal boundaries when plausible.
3 - These ridings should aim to contain 5 members each, but could have as many as 9 or few as 3.
4 - These urban ridings will use STV. Each voter has 1 ballot and ranks candidates preferentially.
5 - Rural ridings will continue to use FPTP.
As such, urban ridings will be similar to what exists in Ireland.
Liberals
For the Liberal Party, this system allows them to achieve some of their goals. First off, the introduction of a preferential ballot in urban ridings will mean more Liberals elected. Even in my example, I did not do any STV calculations. As such, chances are we could see as many as 15 more Liberals win, and hence, possibly, retain their majority, though unlikely. This allows the Liberals to follow through on their promise to end FPTP, and due to the ranked ballot, likely improves the position of the party in all future elections compared to base PR. By adopting this, the party can claim a victory for Proportional Representation. It could also use this to justify making any further changes towards PR that would jeopardize the party's position. For a party that's yet to really take a stand for anything in particular on the electoral reform front, this allows the Liberals to sell this to caucus as well, telling the PR backers this is as good as it gets, and the FPTP backers that this is as little change as is possible.
Tories
For the Tories, a change from FPTP is risky. Keeping it in the rural areas of the country is an important selling point to them that will ensure they can back this. In fact, it is often the small c conservative party that walks away after an election with 0 seats in various large urban areas. This change means that will never happen again, as the Tories can be all but guaranteed MPs from large cities, only needing to win, for example, 20% of the vote to gain 1 MP in a 5 seat Riding. This can easily be sold as keeping bedrock blue ridings they way they are while allowing for the party to win previously unwinnable ridings. For the party, and their supporters, the fear of never having another Conservative majority again is what drives opposition to any change. By introducing a system that allows for a future Conservative majority, we can gain not just the party's members on the committee, and it's caucus in the house, but we can also gain the support of Conservative members and voters. This is crucial to winning any referendum on the issue.
NDP
For the NDP this might be the toughest sell. The party is strongly in favour of MMP-PR and will push for it whenever and wherever possible. For that reason, if the proposal I've outlined is moved forward, I strongly suspect the Liberals and Tories will use their combined majority on the committee to present the NDP with a difficult choice. They will make this proposal the only official proposal the committee is going to look at. In effect, they will tell the NDP to either back this proposal, or back nationwide FPTP. While the NDP will loudly complain, I suspect at the end of the day, they will comply, and back this proposal as well. As such, when this proposal leaves the committee, it will have the backing of all 3 of the national parties. I can also see the NDP backing this in a referendum, telling their supporters that some PR is better than no PR, and that the NDP will make MMP-PR a coalition issue after the first election using our new system (which will be more likely to produce minority governments).
Bloc
For the Bloc, seen as an anti-PR party, there is an important gain to be made. The Bloc, for many years, won 50%+1 of all seats in Quebec. If you look from that perspective, it makes little sense to change. However, in the last two elections the Bloc has won 4, and 10 seats, less than 1/7th of the seats in the province. While this system will mean that we won't be seeing the Bloc sweeping the province, it also means that during the difficult times, the party has a base of support it can rely on. It is thus guaranteed to always have at least a few MPs in the commons so long as this system remains in place. Additionally, this system means it's possible for an anglophone Bloc member to be elected as an MP for anglophone Montreal. This is something the party would very much like to achieve. As such, I could see the Bloc back this, especially given their past historical successes in rural Quebec.
Green
For the Greens, there seems to be no reason to back this on the surface, but that is when we get into something I've been eluding to for a while. My calculation is not a real election, it was a quick and dirty example. When New Zealand introduced Proportional Representation, voting patterns changed. We've also seen this in other areas that go from non-proportional to proportional systems. What that means, bluntly, is we could see the nationwide Green vote go from 5% to 10%. STV also means as candidates drop, the preference flows from other candidates can end up boosting someone to victory. With the Liberals and NDP being "parties of government" in many provinces, it's possible (likely in fact) that people may vote for a local Liberal/NDP MP they like #1, and preference a Green #2 because of perceptions of 'not caring' or outright corruption among the brass of their prefered party. The Greens, as such, would actually gain by a move to this new system, and would also be all but guaranteed a handful of MPs.
This is by no means a lock. It's quite possible no party will want to back this idea, especially if events back them into various corners. Nor is this the easiest path to a majority on the committee and in the commons. However; this is the most likely way to get all 5 parties on board, and to pass any referendum. Since it uses the existing map (simply 'clumping' existing ridings together) it is also something that can be done 'quickly' by the government, as oppose to having to take the time of redrawing the entire electoral map. When this has been used in the past in places like Manitoba and Alberta it has been abandoned after a few elections, but with more and more Canadians calling for PR, it's quite possible that when this system is replaced, it is replaced with another system that is far more proportional.
Saturday, September 3, 2016
Urban PR, what that might look like
You may have noticed some errors with the last set of maps, as such, I've done updated maps, and these maps include what I see as likely PR/STV districts.


As eluded to in the description, I expect these would be STV, like Ireland, Australia's Senate, or the previous "BC-STV" proposal.
You'll note that for Montreal and Toronto, the colours indicate the multi-member ridings, while for the other maps, those multi-member ridings are shown in grayscale. Most provinces have both rural (single member) ridings and urban (multi member) ridings. Newfoundland and New Brunswick have no such 'urban' ridings, and Prince Edward Island has no such 'rural' ridings.
Nova Scotia and Manitoba both have a single "urban" riding, containing the capital. Saskatchewan has two, one for each large city. Alberta has 4 such ridings, two for each large city, while BC has 5, 4 in the greater Vancouver area, and one on part of Vancouver Island.
Quebec has 8 such ridings, none of which contain under 4 members, while Ontario has a whopping 16 urban ridings. All of these ridings in all of these provinces have between 3 and 9 members, trying to aim for 5 as a good balance. This is what's recommended for STV.
I'd like to examine how this would impact the last federal election. I'm going to make the presumption that rural ridings will be FPTP (though as I'll make clear in my next post, this isn't likely, but it is easier to calculate) and as opposed to straight out STV, I will presume the urban ridings use d'hondt PR, as that's easier to calculate as well. I will then compare this to both straight FPTP (IE the real results) and straight PR (IE nation-wide d'hondt) to show what this means.
Lets start at sunrise, in Newfoundland. Without any "urban" ridings, nothing changes. In Nova Scotia we have 4 ridings rolled into one. As such we lose 4 Liberal MPs to be replaced by the proportional results, which are 4 Liberals, and 1 New Democrat. This moves us on to PEI, which has a single province-wide riding. The 4 Liberal MPs are replaced with 3 Liberal MPs and a Tory MP.
As a result, in the Atlantic, we go from 32 Liberals to, to 30 Liberals, 1 Tory, and 1 New Democrat. The Atlantic, however, is not known for it's large urban areas, so, we'll hop over to the Prairies. Manitoba loses all 7 Liberal MPs and 1 NDP MP in Winnipeg, which is replaced with, 5 Liberals, 1 NDP MP, and 2 Tories.
In Saskatchewan we have two ridings. In Saskatoon, we replace 1 Tory MP with a Liberal (the other Tory, and New Democrat remain). In Regina the current balance would not change.
As a subtotal, we are currently down by 3 Liberals, and up by 2 Tories and 1 New Democrat. However, we've yet to hit urban areas that are both large and solidly for one party or another. As such, you can expect more change as we go.
In Alberta we have 4 multi-member ridings. South Calgary we exchange 1 Tory for a Liberal, and we do the same for the rest of Calgary, which gains 1 Liberal at the expense of a Tory. South Edmonton produces the same result, 1 additional Liberal at the expense of a Tory, while North Edmonton shakes things up by gaining us not only 1 Liberal, but also 1 New Democrat, both at the expense of Tories. As such Alberta produces 4 additional Liberals, and 1 additional New Democrat, whole losing 5 Tories, for a new subtotal of +1 Liberals, +2 New Democrats, and -3 Tories.
In BC we have a number of multi-member ridings. In the Capital Region, the Liberals gain 1 seat from the NDP. The sprawling north-shore coquitlam area would gain 2 Tories at the expense of the Liberals, white it's southern counterpart in the surrey-abbotsford area would gain 1 New Democrat from the Liberals. The Richmond-Delta-Burnaby area would gain 1 Tory at the expense of the New Democrats. Lastly Vancouver, which gains us a Tory at the expense of the Liberals, for a new subtotal of -2 Liberals, +1 New Democrats, and +1 Tories.
In Quebec City, we have the NDP gain 1 from the Tories. Our first big change comes from Laval, where the Liberals would lose a whopping 3 seats, one each to the NDP, Tories, and Bloc. The North Shore would also see huge changes. The Liberals would retain their seats, but the Bloc would lose 2 to the NDP, and 1 to the Tories. In the northern Monteregie area, the only change is 1 Bloc gain from the Liberals. This compares to the northern Monteregie area, where both the NDP and Bloc gain 1 from the Liberals. This brings us to a new subtotal of -8 Liberals, +6 New Democrats, +2 Tories, and +-0 Bloc
The Island of Montreal is large. The northern riding sees the Bloc and NDP gain 1 seat each from the Liberals. The Eastern riding sees the Bloc gain 1 from the NDP. The Western riding sees the Tories gain 1 from the Liberals. This brings us to a new subtotal of -11 Liberals, +6 New Democrats, +3 Tories, and +2 Bloc
In Ontario we have a large number of such ridings. Windsor sees the Liberals and Tories each gain 1 from the NDP. London gains 1 Tory from a Liberal, and Simcoe would gain 2 Liberals from 2 Tories. However Simcoe highlights a problem, as the NDP almost just wins a seat here, but on the math I'm using, just barely does not. Ottawa would see a gain of 1 each (NDP and Tory) from the Liberals. Durham would see 1 NDP gain from the Liberals, and they would do the same in the Niagara region. Both the Waterloo and Halton regions would see 1 NDP gain from the Liberals as well, while Hamilton sees no changes. Brampton sees 1 gain each, Mississauga sees 2 Tories and 1 NDP gained, all from Liberals. This brings us to a new subtotal of -20 Liberals, +11 New Democrats, +7 Tories, and +2 Bloc
The York Region and Toronto are all that's left. In the former we see a change with the NDP gaining 1, and the Tories gaining 2 from the Liberals. This leaves only Toronto, where the Liberals hold all the seats, and all gains will be from them. Etobicoke would see the Tories gain 1, while Scarborough sees 1 NDP gain, and 2 Tories. North York has 3 Tory gains, while the rest of Toronto has 3 New Democrat gains, and finally, a Tory gain. This brings us to a new subtotal of -35 Liberals, +16 New Democrats, +17 Tories, and +2 Bloc
The "election result" is thus:
149 - Lib
116 - Con
60 - NDP
12 - BQ
1 - Grn
The difference from this to the real results (and PR results) are as follows:
-35 (-14) Liberal
+17 (-7) Conservative
+16 (+7) New Democrats
+2 (+4) Bloc Quebecois
+-0 (+10) Green Party
As you can see this does have some of the impact of STV, in that smaller parties (IE the Greens) do not do well. Beyond that, our results are pretty close, we get "about 2/3rds" of the way towards a fully proportional system. (Unsurprising, as this is "about 2/3rds" of ridings that are impacted)
Tomorrow I'll explain the "politics" around this, and why each party could gain.
Subscribe to:
Posts (Atom)